Figure 6.

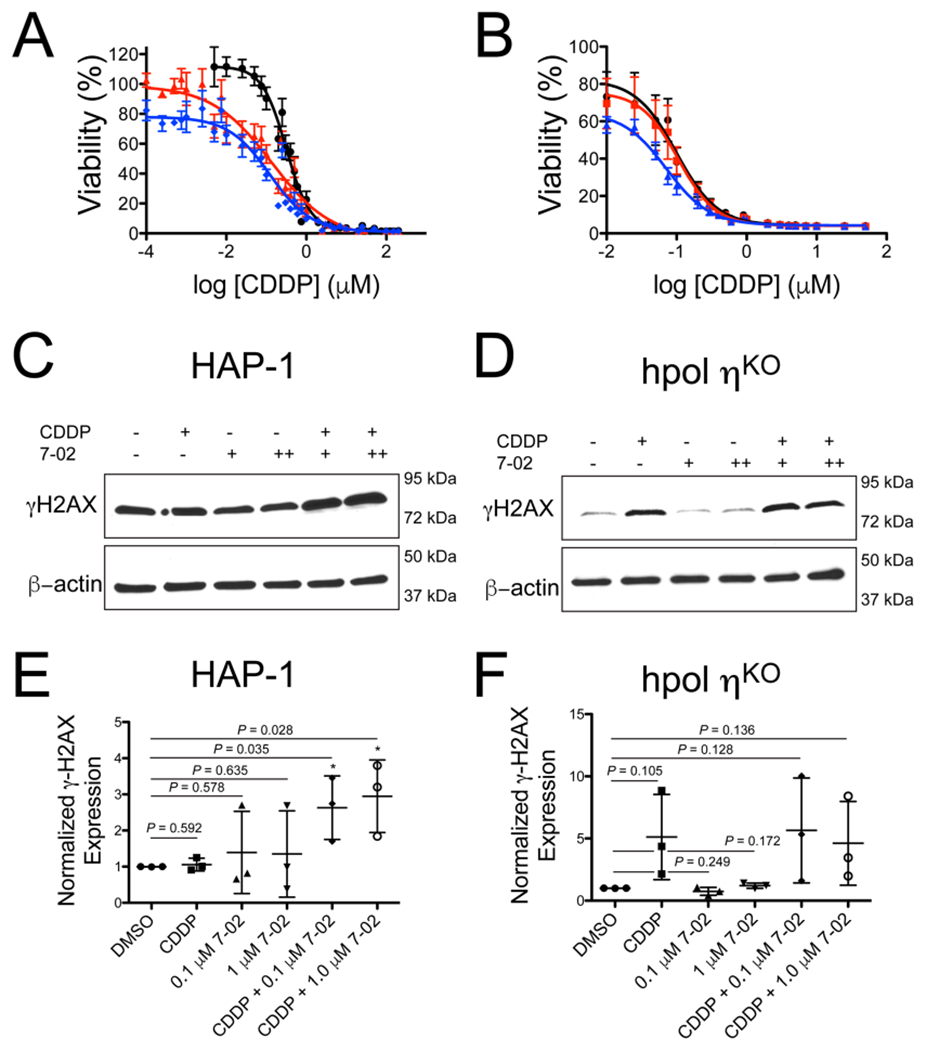
PNR-7-02 potentiates the cytotoxic effects of CDDP in a manner largely dependent on hpol η expression. Cell viability was measured for parental HAP-1 cells expressing hpol η (panel A) and hpol η-deficient cells (panel B) treated with CDDP alone (black circles), CDDP + 0.1 μM PNR-7-02 (red triangles), or CDDP + 1 μM PNR-7-02 (blue diamonds). The values reported represent the mean (±SEM) of n =12 for panel A and 6 for panel B. The EC50 values derived from the dose–response curves for HAP-1 cells expressing hpol η (panel A) were 0.31 (0.27–0.37) for CDDP alone, 0.14 (0.08–0.23) for CDDP + 0.1 μM PNR-7-02, and 0.12 (0.08–0.17) for CDDP + 1 μM PNR-7-02. The EC50 values derived from the dose–response curves for hpol η-deficient cells (panel B) were 0.10 (0.07–0.14) for CDDP alone, 0.10 (0.08–0.15) for CDDP + 0.1 μM PNR-7-02, and 0.07 (0.06–0.09) for CDDP + 1 μM PNR-7-02. The reported EC50 values represent the mean (95% confidence interval). hpol η-proficient HAP-1 (C) and hpol η-deficient cells (D) were treated with either DMSO or CDDP (0.5 μM) in combination with PNR-7-02 (0.1 and 1 μM) at the indicated concentrations. Immunoblotting was performed to assess changes in γH2AX levels. Quantification of γH2AX expression (normalized against β-actin and relative to DMSO-treated cells) is shown for hpol η-proficient HAP-1 (E) and hpol η-deficient knockout cells (F). The mean (±SD) is shown for three biological replicates. A Student’s t test was used to calculate the P values.
