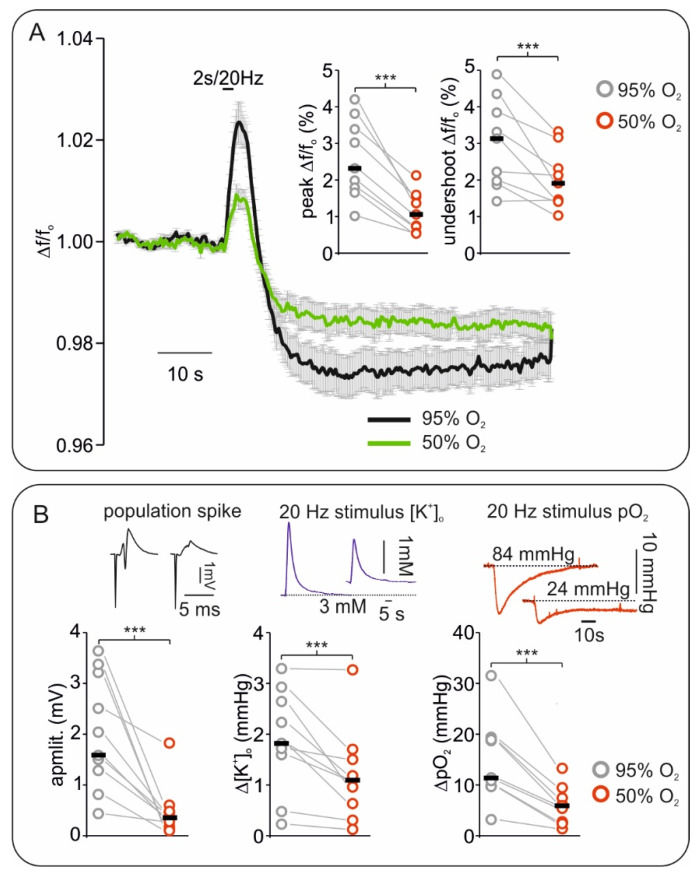
Figure 2.
Effects of hypoxia on stimulus induced Flavin adenine dinucleotide (FAD) signals correlates with changes in electrophysiology. (A) Averaged curve of stimulus induced FAD transients elicited by 20 Hz/2 s stimulus train. Compared with the control (black curve), peak (oxidation) and undershoot (reduction) FAD response to stimulation decreased during hypoxia (green curve, error bars represent standard error). Right corner on top: plot of changes in FAD oxidative peaks and reductive undershoots during 95% and 50% oxygenation (grey circles: control, and red circles: hypoxia, black lines: median values). (B) Plots and exemplary traces of stimulus induced field potential, extracellular potassium ([K+]o) and tissue oxygenation (pO2) changes during hypoxia. Left, the amplitude of single pulse stimulus-induced population spikes (example on top) decreased during hypoxia suggesting impaired synaptic transmission. Middle: [K+]o increases elicited by 20 Hz tetanus decreased in amplitude under hypoxia. Right: pO2 dips simultaneously recorded with tetanus-induced FAD and [K+]o changes decreased. Plots: grey circles: control, red circles: hypoxia, and black lines: median values. All parameters were recorded simultaneously, n = 9, *** = p < 0.001.

