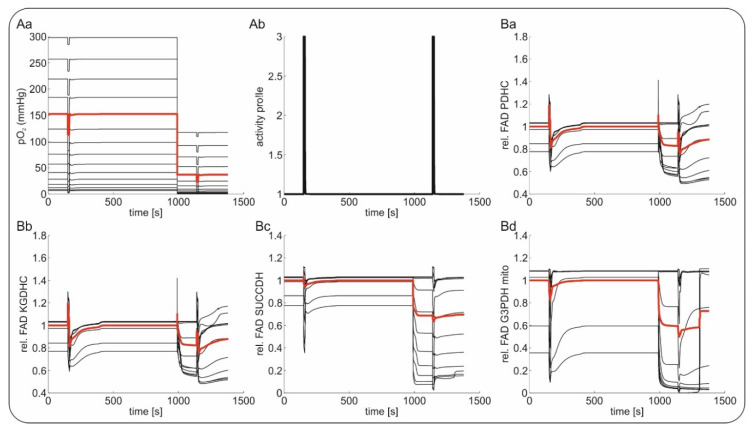
Figure 3.
In silico reconstruction of the Flavin adenine dinucleotide (FAD) redox state during hypoxia in brain slices. (Aa) Reconstruction of tissue oxygenation (O2) gradients in a brain slice in experimental conditions under 95% and 50% oxygenation. (Ab) Similar to the increased energy demand elicited experimentally by electrical stimulation trains (20 Hz/2 s), periods of increased neuronal activation were simulated in silico by increasing intracellular Ca2+, which generated an activity-dependent drop in intracellular ATP. (Ba–d). Simulations of changes in FAD fluorescence in different layers during 95% and 50% O2 of pyruvate dehydrogenase (PDHC, (Ba)), α-ketoglutarate dehydrogenase (KGDHC, (Bb)), succinate dehydrogenase (SUCCDH, (Bc)) and mitochondrial glycereol-3-phophate dehydrogenase (G3PDHmito, (Bd)). Black lines depict the different layers of the slice; the red line gives the mean signal of all black lines.

