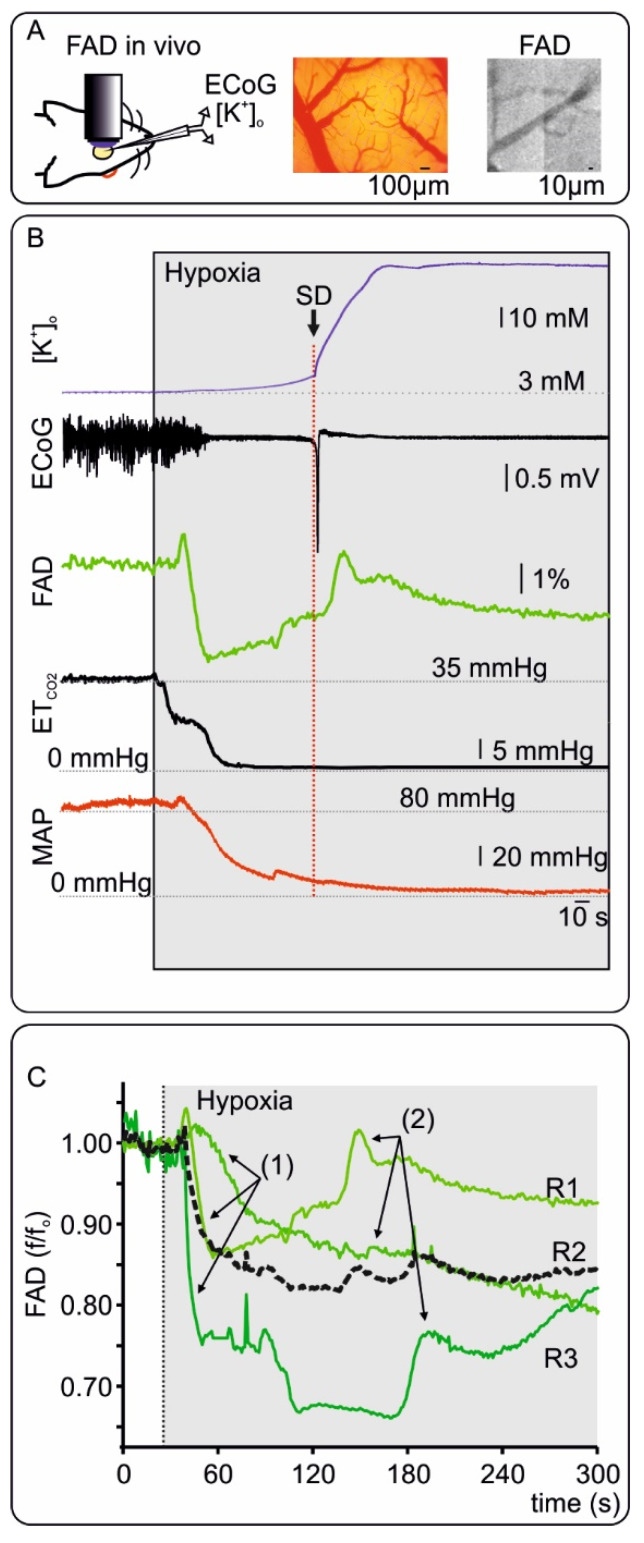
Figure 5.
Changes in Flavin adenine dinucleotide (FAD) fluorescence in vivo during hypoxia. (A) Left: Representation of in vivo FAD microscopy combined with alternate current (AC) electrocorticography (ECoG) and extracellular potassium ([K+]o) measurements. Middle: Picture of the cortex with pial vessels. Right: CCD picture (460nm LED illumination and FAD filter) showing the cortical surface emitting fluorescence and dark pial vessels. (B) Exemplary experiment concerning in vivo changes in FAD during terminal hypoxia and related signals. A few seconds after beginning ventilation with 0% oxygen, [K+]o (blue, trace on top) gradually increased and cortical activity ceased (=non-spreading depression of activity, AC-ECoG trace). FAD-signal displayed a short oxidative peak followed by a marked reductive course. End tidal CO2 (ETCO2) and mean arterial pressure (MAP) decreased indicating circulatory arrest. After about 110 s of hypoxia and significantly after the circulatory arrest (defined as a fall of ETCO2 to zero and a MAP below 30 mmHg), terminal SD then occurred characterized by the sharp and large rise in [K+]o and parallel abrupt large negative shift of the direct current (DC)-ECoG. The terminal SD led to a last oxidative FAD-Peak. (C) FAD traces from three in vivo FAD measurements (R1-3) during hypoxia. Black dotted line represents the average curve of all traces. As shown previously, acute hypoxia is related to FAD reductive shift (1) and an oxidative peak when terminal SD occurs (2). The exemplary recording in B correspond to R1 in C. For details concerning the individual recordings, see supplementary Figure S2.

