Figure 8.
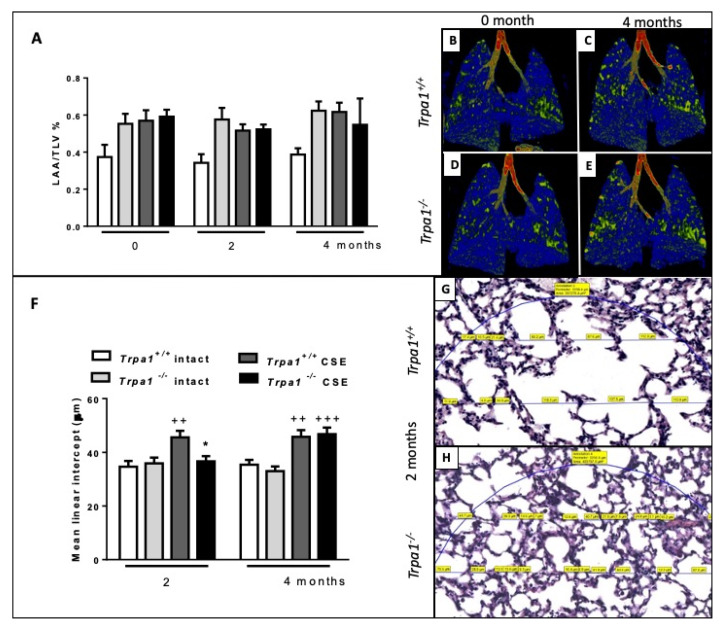
Quantitative evaluation of emphysema. (A) LAA/TLV ratio correlating with air-filled regions of the lungs exposed to CSE showed no significant alterations. Representative microCT pictures of lungs (B,D) before and (C,E) after 4 months of CSE in Trpa1+/+ and Trpa1−/− mice, respectively. (F) Microscopic quantitative assessment of Lm showed a significant increase in Trpa1+/+ already after 2 months of CSE, but not in the Trpa1−/−. Values represent means ± SEM, n = 6–7 mice/group; repeated measures two-way ANOVA followed by Tukey’s post-test. Representative microscopic pictures of (G) Trpa1+/+ and (H) Trpa1−/− mouse lung tissues after 2 months of CSE. Values represent means ± SEM, n = 60–100 measurements/group; two-way ANOVA followed by Tukey’s post-test; ++ p < 0.005, +++ p < 0.001 vs. PBS-treated respective group; * p < 0.05 vs. CSE-treated Trpa1+/+. (The blue circle indicates the region of interest in which Lm was measured. The measured chord lengths represented by blue lines were expressed in µm on the scanned slides and labelled in yellow.).

