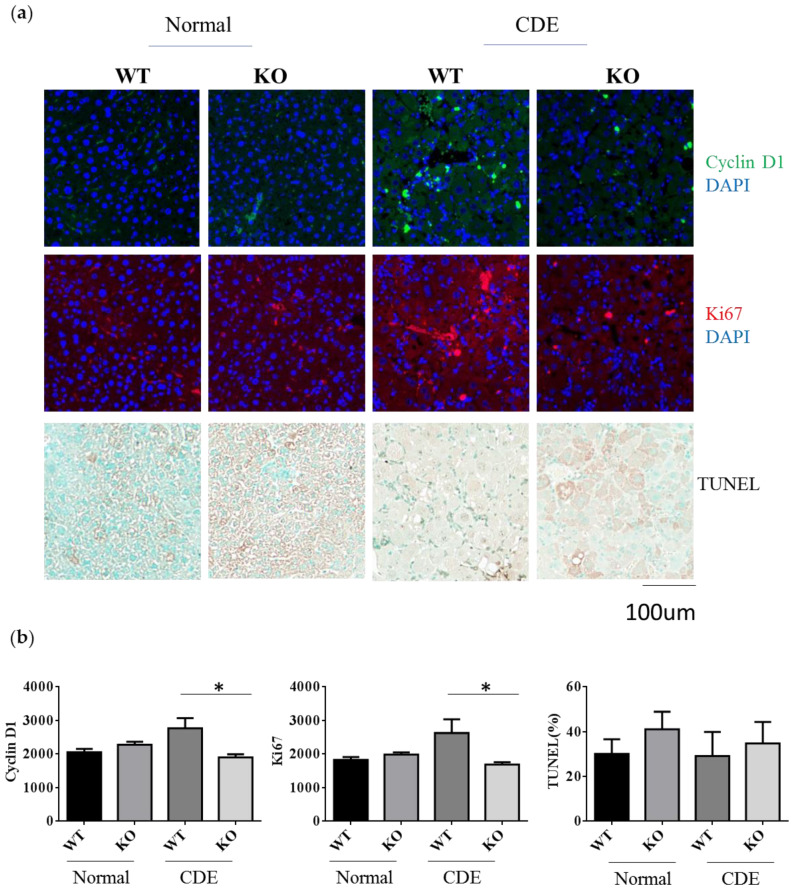
Figure 4.
Reduction of cell proliferation in Erk2−/− (KO) mice under the CDE diet. (a) WT and Erk2−/− liver sections were stained with cyclin D1 and ki-67 with DAPI staining for nucleus. Liver sections were stained with TUNEL assay kit HRP-DAB; (b) The average intensities of cyclin D1 and ki-67were measured by MetaXpress analysis software. (WT, KO n = 3, 6 fields each sample, total 18 fields). The percentages of TUNEL positive area (brown) were quantitated by inform software (WT, KO n = 3, 6 fields each sample, total 18 fields; * p < 0.05).

