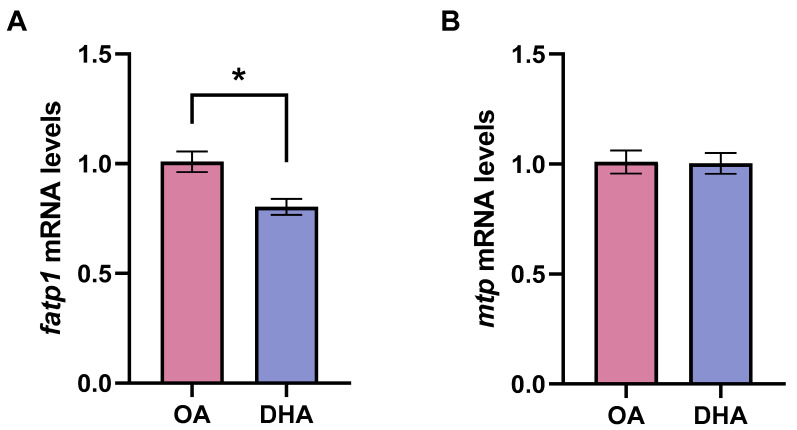
Figure 2.
Transcript levels of fatty acid transport protein 1 (fatp1) (A) and microsomal triglyceride transfer protein (mtp) (B) in mature adipocytes incubated for 6 days with 100 µM oleic acid (OA) or 100 µM docosahexaenoic acid (DHA). Samples (n = 8) were analyzed with real-time qPCR; data are presented as fold change ± SEM using ef1α as a reference gene and the OA group was set to one (delta-delta method). Asterisks (*) indicate significant differences between conditions (p < 0.05; Student’s t-test).

