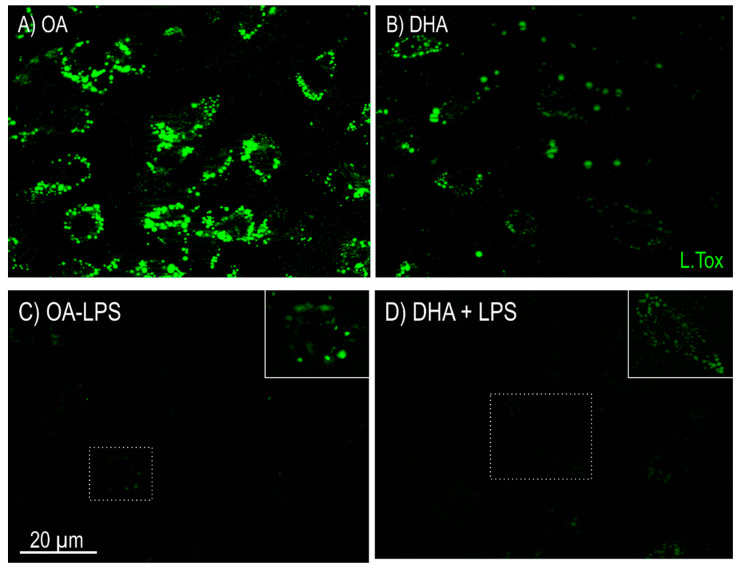
Figure 3.
Imaging of lipid droplets by fluorescence microscopy stained with LipidTOX (green) in mature Atlantic salmon adipocytes in vitro incubated with oleic (OA) (A) or docosahexaenoic acid (DHA) (B) for 6 days. Thereafter, the OA group (C) and the DHA group (D) were exposed to lipopolysaccharide (LPS) for 20 h and imaged using the same microscopy settings. A strong lipolysis effect was observed post LPS treatment, for both OA and DHA treated cells. Boxed areas are enlarged in the upper right corners in (C,D). 30 images were collected per treatment group (10 images per flask). One representative image for each treatment group is shown in this figure.

