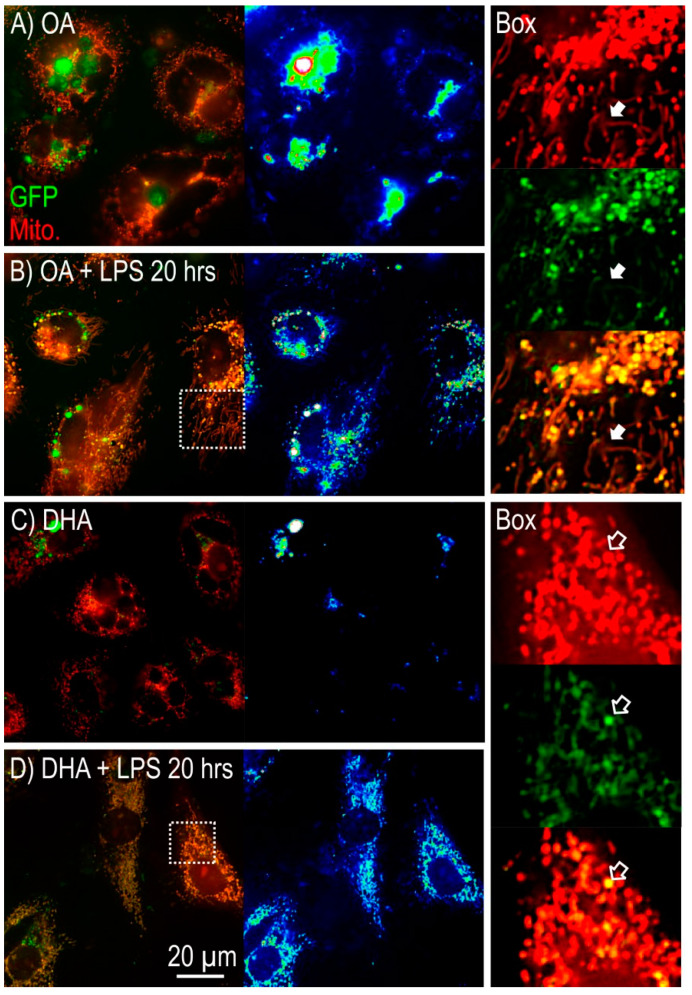
Figure 4.
Imaging of mitochondrial morphology in mature Atlantic salmon adipocytes in vitro incubated with oleic acid (OA) (A) or docosahexaenoic acid (DHA) (C) for 6 days. Thereafter, the OA group (B) and the DHA group (D) were exposed to lipopolysaccharide (LPS) for 20 h. Mitochondria were visualized using MitoTracker (red) and a mitochondrial targeting SOD2-GFP construct (green). The panel on the right shows the area highlighted in the white dotted box for (B,D), showing the red channel, the green channel, and the merged image (colocalization shown in orange/yellow). Solid arrows point to fragmented mitochondria and open arrows point to round mitochondria.

