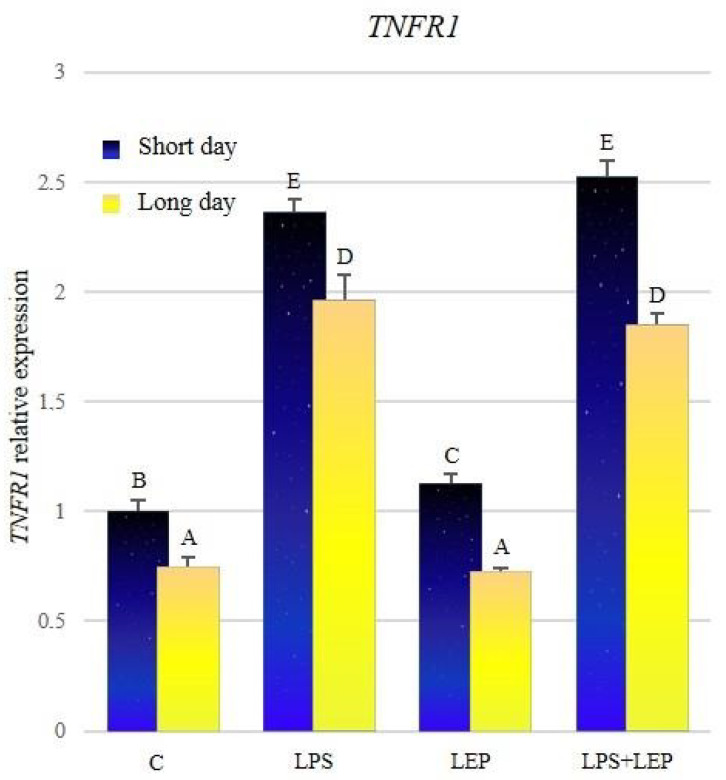
Figure 8.
TNFR1 gene expression in relation to the mean of HDAC and ACTB reference genes in the sheep’s anterior pituitary during the short-day and long-day photoperiod. Groups: C—control groups, LPS—LPS-treated groups, LEP—leptin-treated groups, LPS+LEP—groups treated with LPS and leptin. The data are presented as means ± standard error of the mean (SEM). Letters indicate significant differences between research groups, according to Fisher’s post-hoc test.

