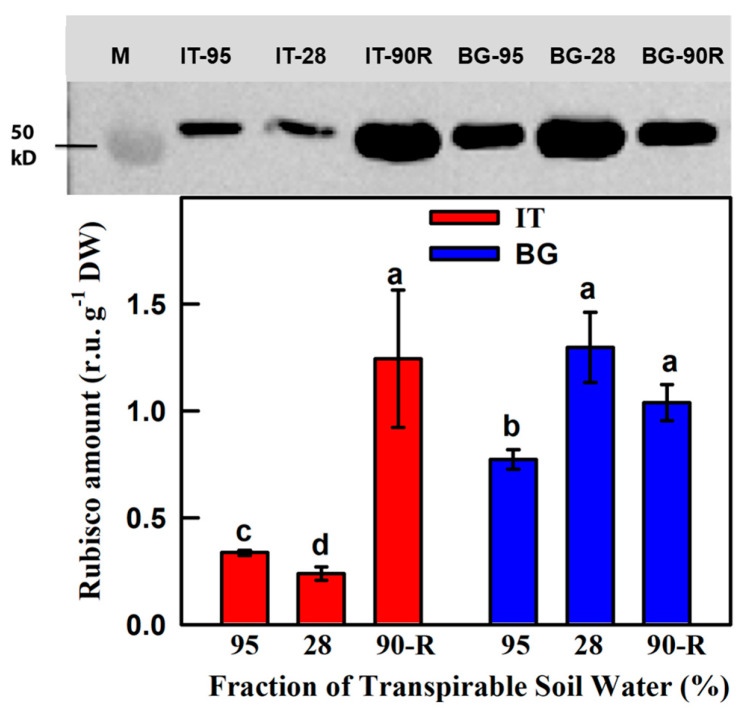
Figure 3.
Rubisco protein content in Italian (IT, red bars) and Bulgarian (BG, blue bars) populations of P. orientalis plants under control (FTSW = 95%) and drought (FTSW = 28%) conditions and after re-watering (FTSW = 90%R). Rubisco protein bands were normalized to the Actin band. Data are means ± SE of six independent samples. Statistically significant differences (Tukey’s test, p < 0.05) between the IT and BG populations are indicated by different letters.

