Figure 1.
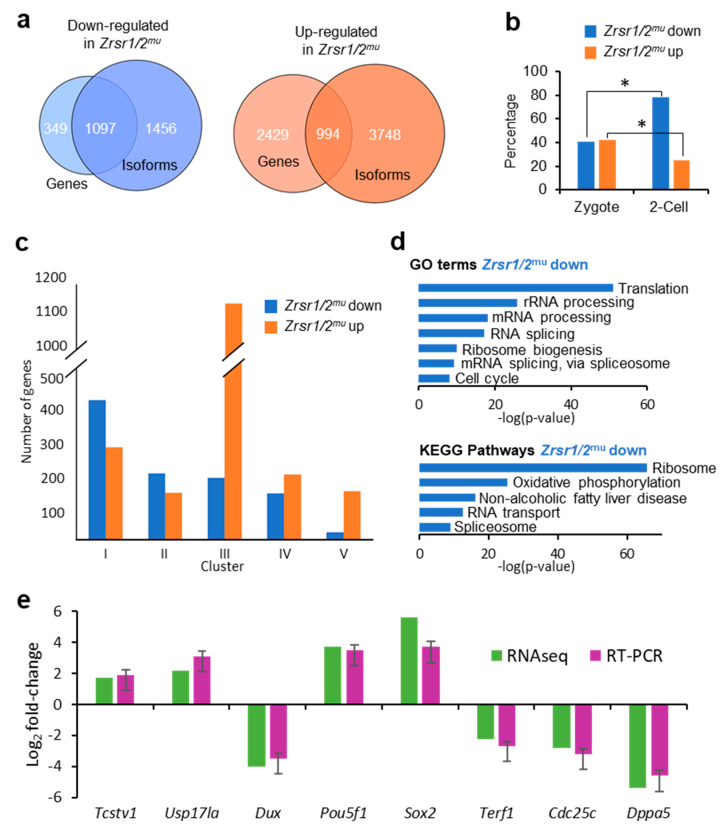
RNA-seq analysis of Zrsr1/2mu embryos, gene ontology, and RT-PCR validation. (a) Venn diagrams comparing up- (orange) or downregulated (blue) genes and isoforms in Zrsr1/2mu vs. wild-type (WT) 2-cell embryos. (b) Percentage of genes up- or downregulated in Zrsr1/2mu that are present in zygote or 2-cell stages in mice [30]; *p < 0.01 (z test). (c) Clustering of differentially expressed genes according to [31]. (d) Significant gene ontology (GO) terms (upper panel) and Kyoto Encyclopedia of Genes and Genomes (KEGG) pathways (lower panel) in differentially expressed genes (DEGs) in the pair-wise comparison are indicated. (e) Validation of RNA-seq data for differential gene expression by qRT-PCR of selected RNAs from Zrsr1/2mu and WT 2-cell embryos (3 pools of 10 2-cell embryos; triplicate results are presented as the mean ± SEM). No statistically significant differences were found by ANOVA followed by Tukey’s post hoc test (p < 0.05).

