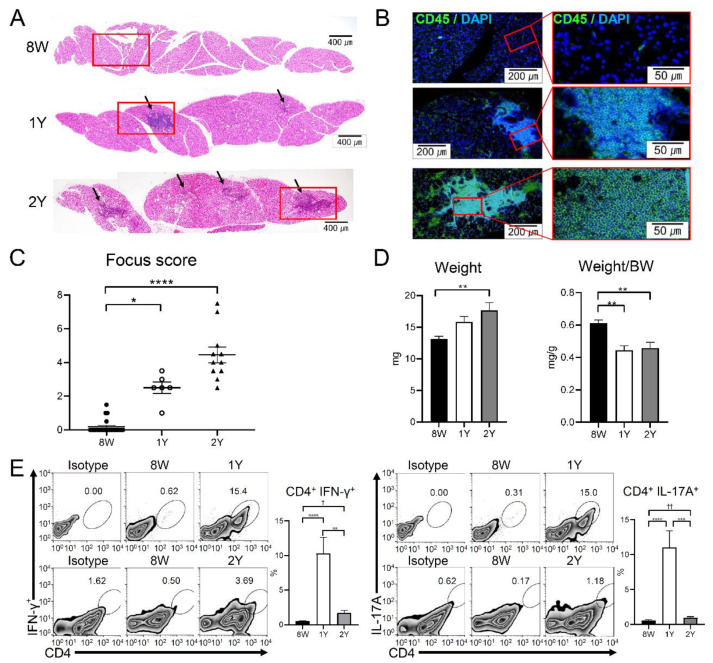
Figure 5.
Representative images of the lacrimal gland (LG) sections acquired by (A) H&E staining (50×) and (B) CD45 immunofluorescence staining (100× and 400×). Arrows indicate lymphocytic infiltration foci. Red boxes of subfigure A are enlarged in subfigure B. (C) The inflammation focus score was higher in 1Y- and 2Y-old mice than in 8W-old mice (p = 0.010 and p < 0.0001, respectively; Kruskal–Wallis test followed by Dunn’s post hoc test; n = 22, 6, and 11 for 8W-, 1Y-, and 2Y-old mice, respectively). (D) LG weight was higher in 2Y-old mice than in 8W-old mice (p = 0.003; one-way ANOVA followed by Tukey’s post hoc test); however, the body weight (BW)-adjusted LG weight was lower in 2Y- and 1Y-old mice than in 8W-old mice (p = 0.002 and 0.001, respectively; one-way ANOVA followed by Tukey’s post hoc test; n = 8, 6, and 6 for 8W-, 1Y-, and 2Y-old mice, respectively). (E) After forward-scatter and side-scatter gating in the LGs, CD4+ IFNγ+ and CD4+ IL-17A+ cells were identified. The percentages of CD4+ IFNγ+ cells were higher in 1Y-old mice than in 8W- and 2Y-old mice (p < 0.0001 and p = 0.0015, respectively; one-way ANOVA followed by Tukey’s post hoc test). The percentages of CD4+ IL-17A+ cells were also higher in 1Y-old mice than in 8W- and 2Y-old mice (p < 0.0001 and p = 0.0004; one-way ANOVA followed by Tukey’s post hoc test). Although the percentages of CD4+ IFNγ+ cells and CD4+ IL-17A+ cells of 8W- and 2Y-old mice were not significantly different in a post hoc test (p = 0.785 and 0.975, respectively), there was a significant difference (p = 0.010 and p < 0.001, respectively) when an independent t-test was performed on only 8W- and 2Y-old mice. (n = 13, 6, and 3 for 8W-, 1Y-, and 2Y-old mice, respectively.) * p < 0.05, ** p < 0.01, and **** p < 0.0001 for the post hoc test, and † p = 0.010 and †† p < 0.001 for the independent t-test. Data are presented as means ± standard error.

