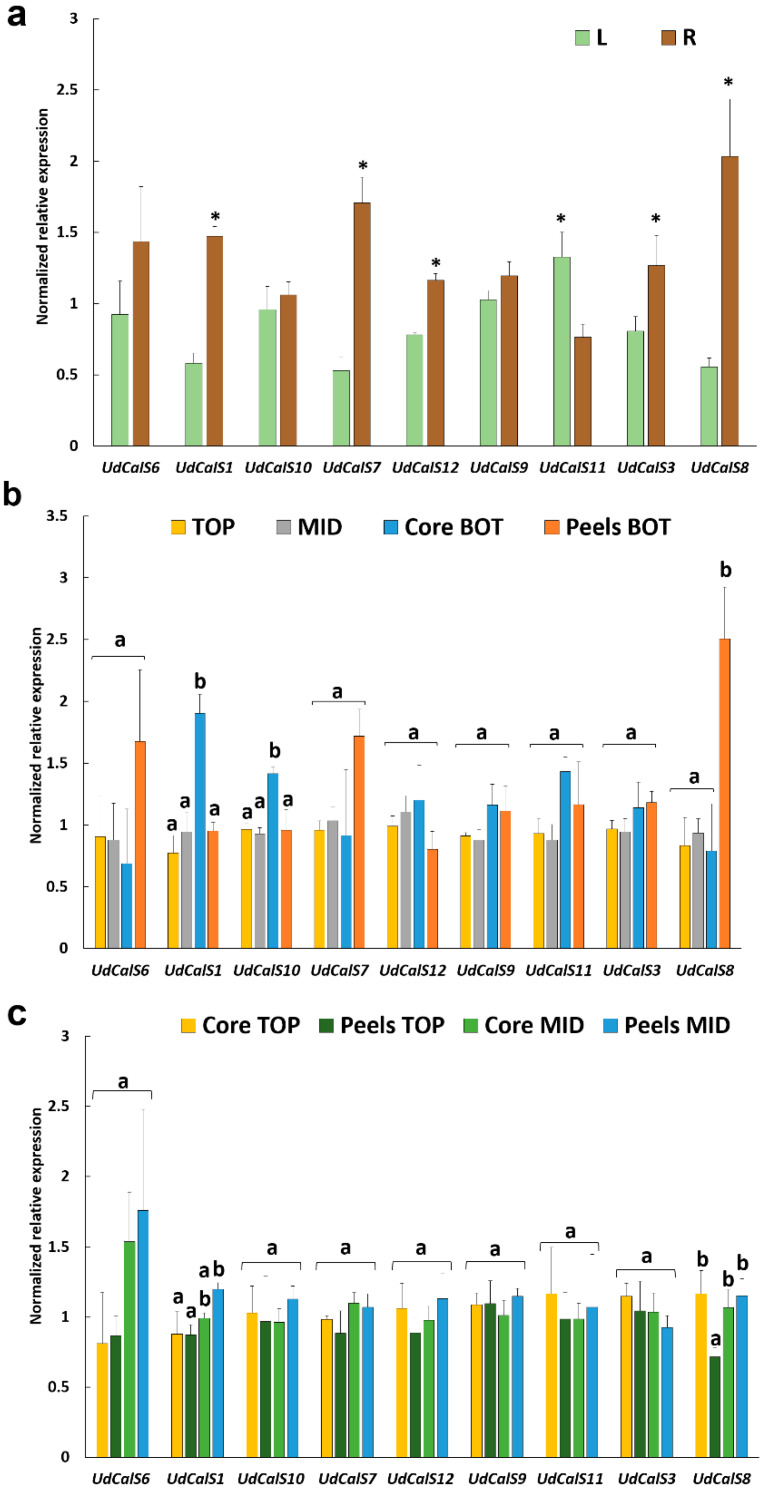
Figure 3.
Gene expression analysis (expressed as Normalized relative expression) in (a) the leaves and roots, indicated with L/R, (b) whole internodes of the top and middle and in the inner and outer tissue of the bottom internode, referred to as Core BOT, Peels BOT and (c) in the inner and outer tissue of the top and middle internodes, indicated as Core TOP/MID, Peels TOP/MID. Error bars correspond to the standard deviation calculated from four biological replicates. Asterisks in (a) indicate statistically significant differences (p-value < 0.05) at the Student’s t-test. Different letters on the vertical bars in (b) and (c) indicate statistically significant differences (p-value < 0.05) among groups. In (b) a Kruskal–Wallis test followed by Dunn’s post-hoc test was used for UdCalS7-12-11-8, while an ANOVA one-way analysis followed by Tukey’s post-hoc test was applied to all the remaining genes [UdCalS6 F(3,11) = 2.44, p-value = 0.119; UdCalS1 F(3,11) = 16.54, p-value = 0.000; UdCalS9 F(3,12) = 3.24, p-value = 0.60; UdCalS3 F(3,11) = 1.92, p-value = 0.184; UdCalS10 F(3,11) = 9.44, p-value = 0.002]; in (c) a Kruskal-Wallis test followed by Dunn’s post-hoc test was used for UdCalS1-11, while all the other genes were analysed with an ANOVA one-way followed by Tukey’s post-hoc test [UdCalS6 F(3,10) = 3.01, p-value = 0.081; UdCalS10 F(3,12) = 0.62, p-value = 0.661; UdCalS7 F(3,12) = 2.95, p-value = 0.75; UdCalS12 F(3,12) = 1.53, p-value = 0.256; UdCalS9 F(3,10) = 0.72, p-value = 0.562; UdCalS3 F(3,11) = 1.28, p-value = 0.342; UdCalS8 F(3,12) = 11.81, p-value = 0.001].

