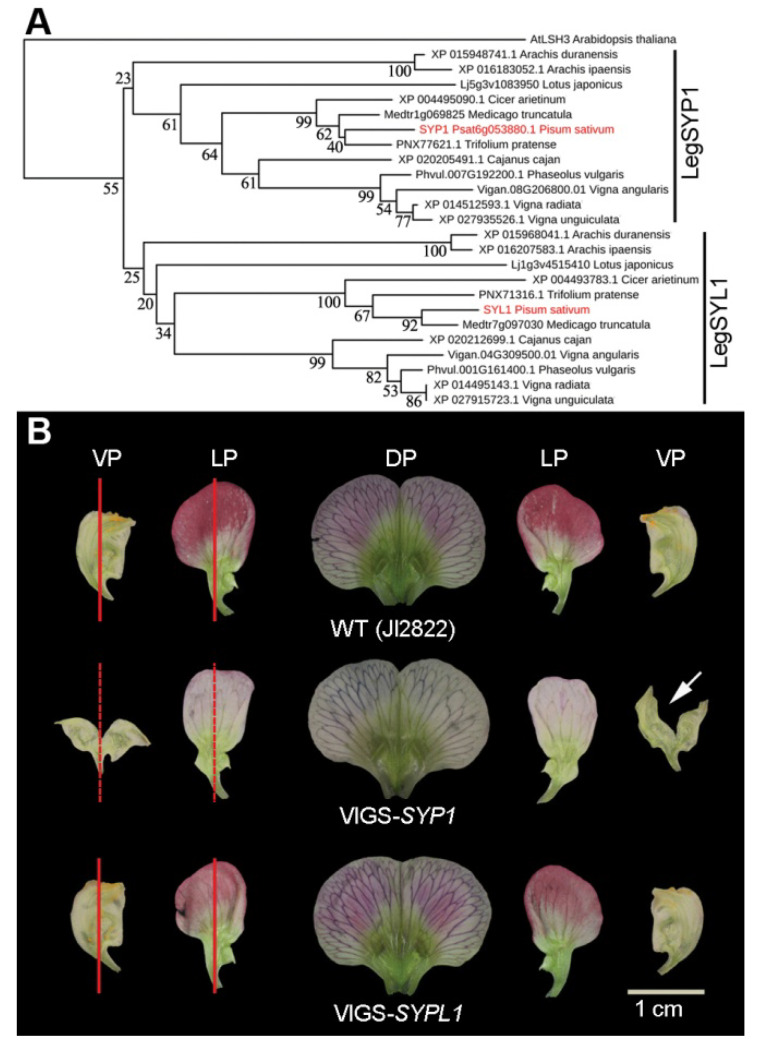
Figure 4.
Phylogenetic analysis of LSH3 orthologs in legumes. (A) The neighbor-joining tree of AtLSH3 orthologs in legume plants. The bootstrapping value is located in each node as percentages along the branches. Red lines indicate two proteins in pea, SYP1 and SYL1. (B) The lateral petals and ventral petals of the wild type and VIGS-SYP1 and VIGS-SYL1 silenced plants. The red lines indicate the IN asymmetry and the dotted lines indicate the abolishment of IN asymmetry. The arrow indicates where the ventral petal was cut to flatten the petal. DP, dorsal petal; LP, lateral petal; VP, ventral petal.

