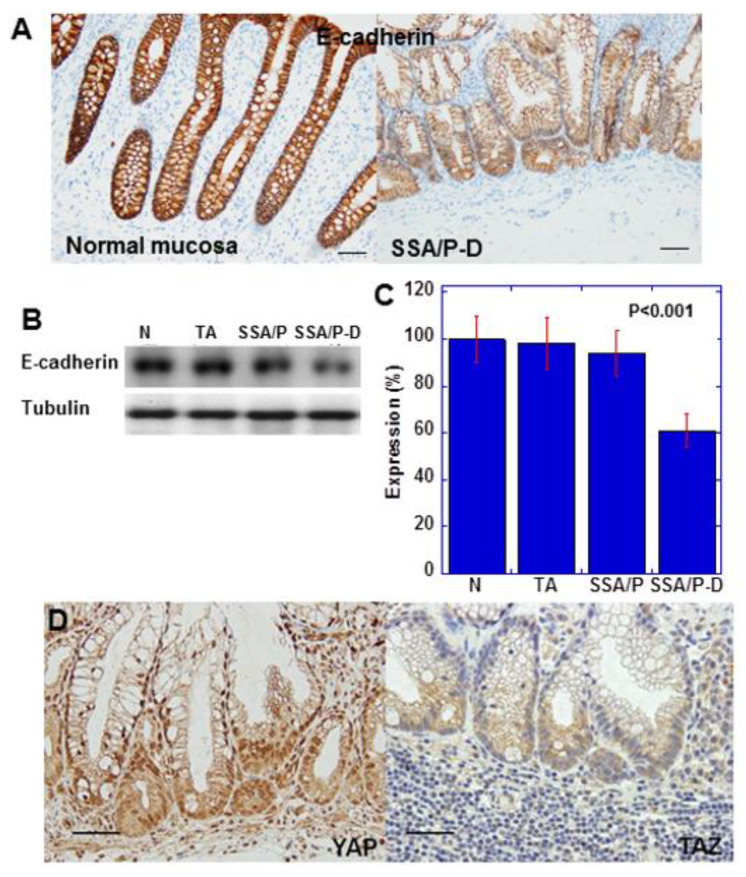
Figure 2.
Expression of E-cadherin and YAP in SSA/P-D. (A) E-cadherin protein expression compared between normal mucosa and SSA/P-D. (B,C) E-cadherin protein levels detected by western blot analysis. (D) YAP and TAZ protein expression examined by immunohistochemistry. Scale bar, 100 μm; N, normal mucosa; TA, tubular adenoma; SSA/P, serrated sessile adenoma/polyp; SSA/P-D, SSA/P with dysplasia; Error bar, standard deviation from three independent trials.

