Figure 6.
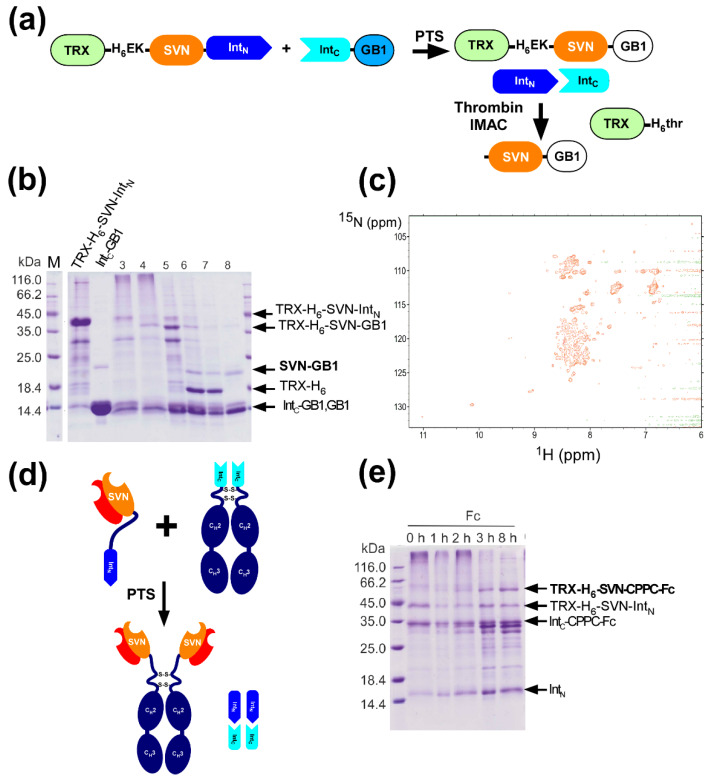
A lectin fusion protein, ‘lectibody’ (a) Schematic drawing of the ligation of a lectin (SVN) with a model protein (GB1) by PTS. (b) SDS-PAGE analysis of the protein ligation of SVN and GB1. The first two lanes show separately prepared N- and C-precursor proteins (TRX-H6-SVN-IntN and IntC-GB1). Lanes 3 and 4 show the ligation reaction immediately after the mixture and after 8 h of incubation, respectively. Lane 5 and 6 indicate samples before and after the proteolytic digestion by enterokinase (EK), respectively. Lanes 7 and 8 show samples before loading on a protein A sepharose column and the elution fraction from the column, respectively. (c) [1H,15N]-HSQC spectrum of the segmentally isotopic labeled [15N]-SVN-[14N]-GB. (d) Schematic drawing of the production of SVN-Fc fusion by PTS. (e) SDS-PAGE analysis of the time-course of the ligation between TRX-H6-SVN-IntN and IntC-CPPC-Fc by PTS.

