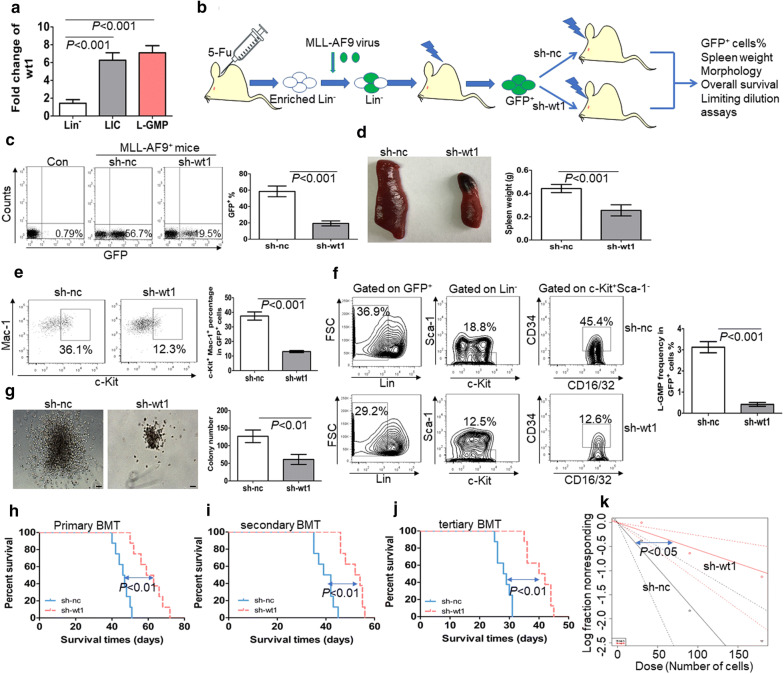
Fig. 1.
WT1 is required for the maintenance of MLL-AF9-induced murine leukemia. a The transcript expression of wt1 is measured in LICs (GFP+c-Kit+Mac-1+) and LSCs (GFP+Lin−c-Kit+Sca-1−CD34+CD16/32+) from MLL-AF9-induced murine leukemia (n = 4) and BM Lin− cells from normal C57/B6 mice (n = 4). b A schematic outline of the in vivo experiment using MLL-AF9-induced murine AML model. c The frequency of GFP+ cells was measured in BM cells from MLL-AF9-induced leukemia with knockdown of wt1 (n = 4) or control nc (n = 4). Shown are the representative plots (left) and statistical analysis of the frequency of GFP+ cells (right). d A representative image of the spleen (left) and statistical analysis of spleen weight (right) in the MLL-AF9-induced murine leukemia with knockdown of wt1 (n = 4) or control nc (n = 4). e Frequency of LICs was measured in GFP+ BM blasts from MLL-AF9-induced leukemia with knockdown of wt1 (n = 4) or control nc (n = 4). Shown are the representative plots (left) and statistical analysis of the frequencies of c-Kit+Mac-1+ cells (right). f Percentage of L-GMP was assessed in BM GFP+ blasts from MLL-AF9-induced leukemia with knockdown of wt1 (n = 4) or control nc (n = 4). Shown are the representative plots (left) and statistical analysis of the frequencies of L-GMP (right). g BM GFP+ cells were isolated from MLL-AF9-induced leukemia with knockdown of wt1 (n = 4) or control nc (n = 4) and then plated on methylcellulose medium. Colonies were counted after 2 weeks (n = 4). Shown are the representative colony pictures (left) and statistical analysis of the number of colonies (right). Bar represents 50 µm. h–j Overall survival was determined in the primary BMT (h, n = 8), secondary BMT (i, n = 8), and tertiary BMT (j, n = 8) of MLL-AF9-induced murine leukemia with knockdown of wt1 or control nc. k Limiting dilution assay of BM GFP+ cells from MLL-AF9-induced murine leukemia with knockdown of wt1 (n = 6) or control nc (n = 6). The frequency of LSC and P-value were calculated by L-calc software

