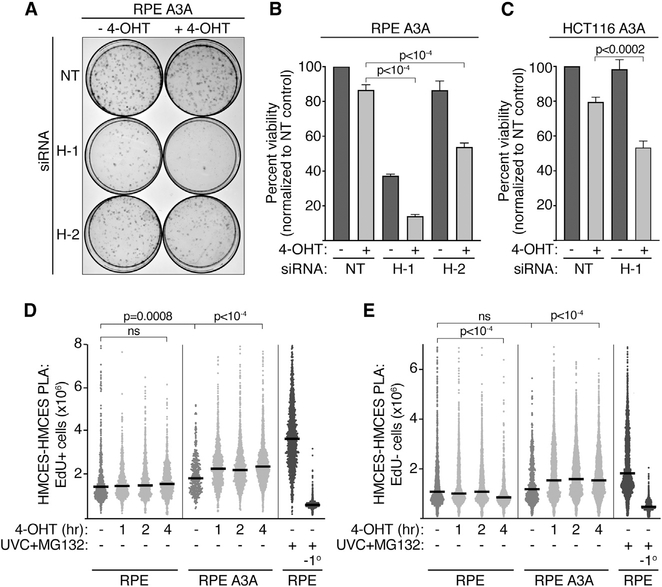
Figure 1. HMCES-Deficient Cells Are Hypersensitive to Nuclear APOBEC3A Expression, Which Promotes HMCES Localization to the Chromatin.
(A) Representative images of a colony-viability assay in hTERT-RPE-1 GFP-APOBEC3A-ERT2 cells transfected with non-targeting control (NT) or HMCES (H-1 and H-2) siRNAs and treated with 4-OHT for 24 h.
(B and C) Quantitation of clonogenic survival assays for RPE A3A (B) and HCT116 A3A (C). Means and SD of 3 experiments. p values were derived from an ANOVA with Holm-Sidak post-test.
(D and E) Quantitation of the insoluble HMCES PLA signal after 4-OHT treatment in EdU-positive (D) and EdU-negative (E) hTERT-RPE-1 cells, with and without stable expression of GFP-APOBEC3A-ERT2. (−1°, no primary HMCES antibody). Each data point represents the HMCES-PLA-integrated nuclear intensity in one cell. Bars represent the median, and p values were derived from an ANOVA with Dunn’s multiple comparisons post-test. See also Figures S1 and S2.

