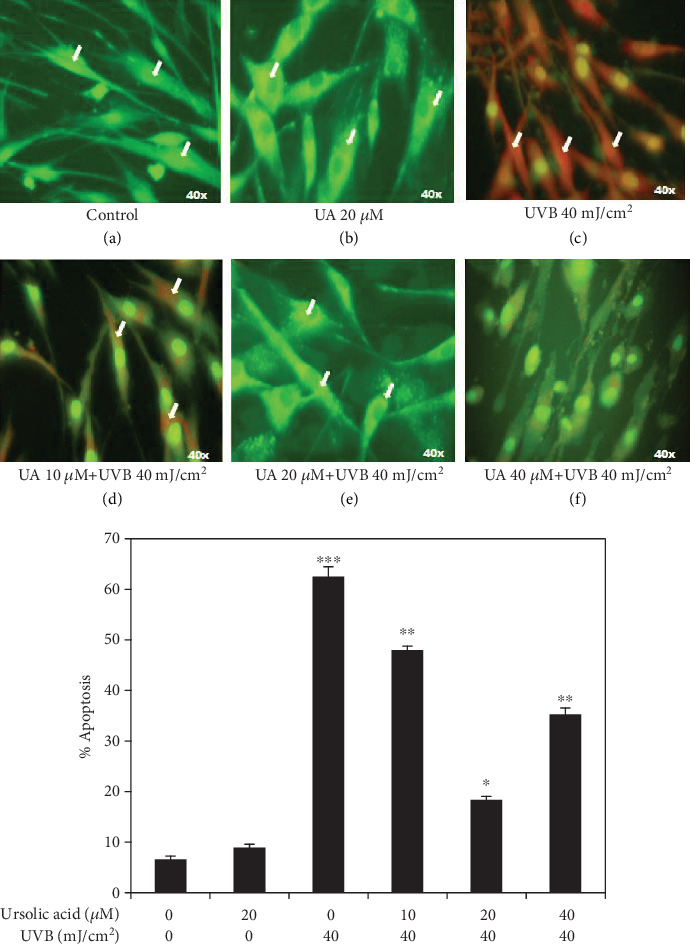
Figure 7.

Fluorescent microscopy imaged of acridine orange/ethidium bromide staining to observed the apoptotic morphological changes in HDFs treated with UA, UVB radiation, and UA+UVB radiation; (a, b) green fluorescence of acridine orange accumulation indicating that apoptosis was not induced by UA 20 μM treated cells; (c) red staining of ethidium bromide indicates severe apoptosis induction in HDFs by UVB 40 mJ/cm2; (d) red and green fluorescent staining showed moderate apoptosis by UA 10 μM+=UVB 40 mJ/cm2; (e, f) strong green staining indicated that apoptosis reduced the treatment of UA 20 μM+UVB 40 mJ/cm2 and UA 40 μM+UVB 40 mJ/cm2. Data analyses are shown in the graph below images. All images were captured at 40x magnification. Values are given as mean ± SD of six experiments in each group; statistical analysis was performed by one-way ANOVA followed by DMRT at P < 0.05, P < 0.01, and P < 0.001 compared to the nonirradiated control. P values not sharing a common marking (∗, ∗∗, and ∗∗∗) differ significantly (DMRT).
