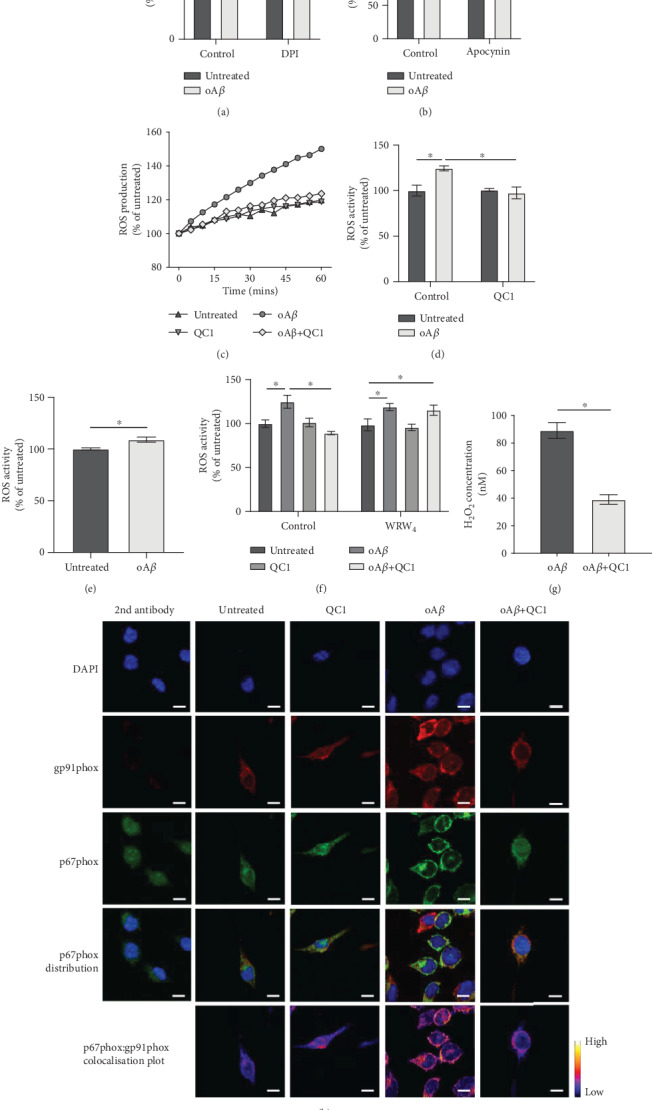
Figure 2.

oAβ-induced ROS production follows activation of NADPH oxidase and is reversed by subsequent Fpr2/3 stimulation. (a, b) oAβ-induced ROS production was prevented by 10 min pretreatment with the NADPH oxidase inhibitors DPI (1 μM, a) and apocynin (1 μg/ml, b). (c) Representative time course of ROS production in untreated BV2 cells and cells exposed to 100 nM oAβ with or without subsequent stimulation with 100 nM QC1 (10 min post-oAβ). (d) Average ROS production rates for BV2 cells treated with oAβ (100 nM, 1 hr) with or without subsequent stimulation with 100 nM QC1 (10 min post-oAβ). (e) Treatment for 1 h of primary murine microglia from wild-type mice with 100 nM oAβ induced significant ROS production. (f) Inclusion of the selective Fpr2/3 antagonist WRW4 (10 μM, 10 min prior to oAβ treatment) did not affect 100 nM oAβ-induced ROS production but prevented the effects of subsequent treatment with QC1 (100 nM, 10 min post-oAβ). (g) Treatment of BV2 cells for 1 h with oAβ (100 nM) induced significant production of the ROS hydrogen peroxide, an effect blocked by subsequent treatment with QC1 (100 nM, 10 min post-oAβ). (h) Treatment of BV2 cells for 30 min with 100 nM oAβ stimulated colocalisation of the NADPH oxidase subunits p67phox (green) and gp91phox (red), an effect prevented by treatment with 100 nM QC1 administered 10 min post-oAβ. Nuclei are counterstained with DAPI (blue); p67phox and gp91phox colocalisation intensity is represented by the false-colour plots. Graphical data are mean ± SEM of 3-6 independent cultures, assayed in triplicate ∗p < 0.05. Images represent cells from 3 independent cultures; scale bar = 10 μm.
