
Figure 2.
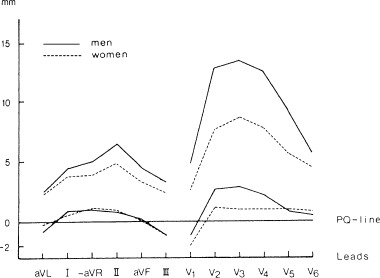
Normal limits of the T wave amplitude (mm) in 163 men and 194 women. Lower and upper limits correspond to 2.5% percentile and the 97.5% percentile, respectively.1 mm = 0.1 mV. From Lundh B: On the normal scalar ECG. A new classification system considering age, sex, and heart position. Acta Med Scand. Supplement 1984;1–145. With permission.