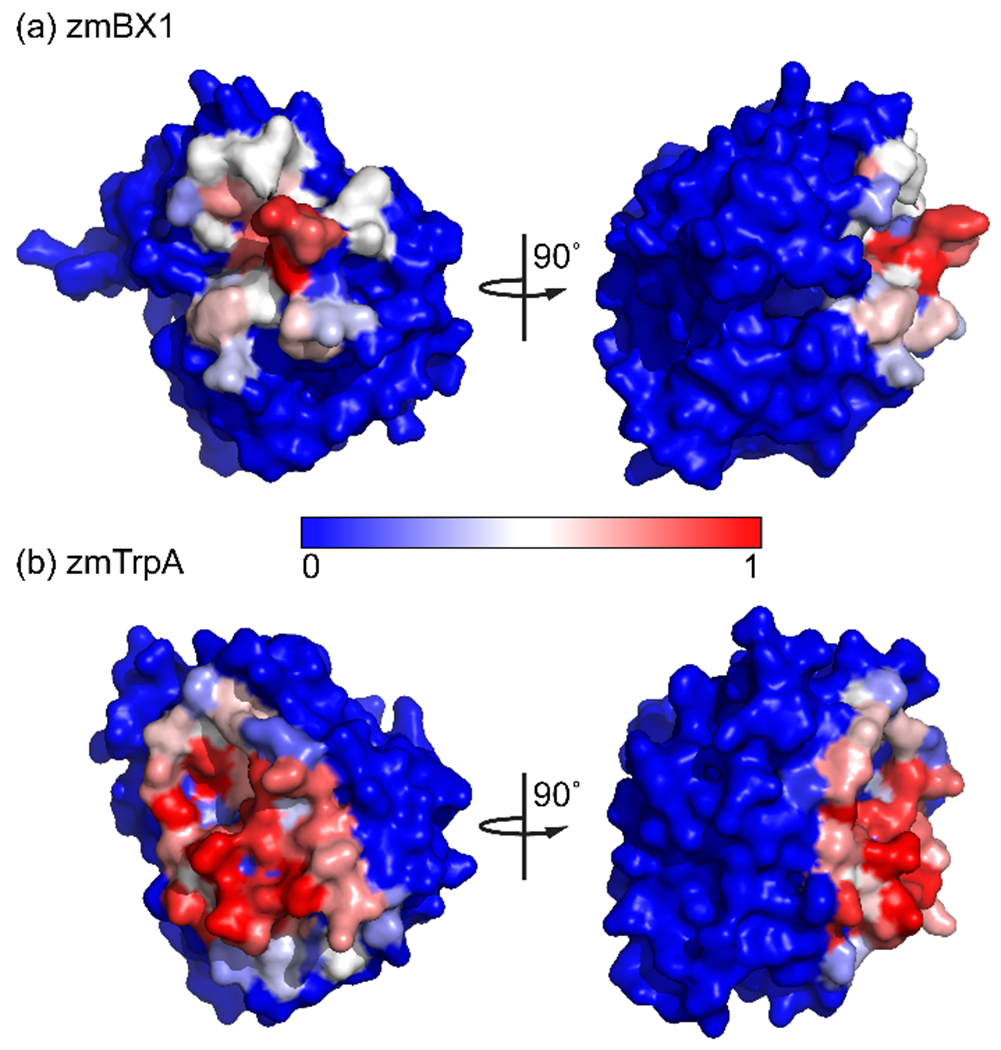
Figure 5.

Comparison of (a) the homooligomerization interface of zmBX1 and (b) the heterooligomerization interface of zmTrpA. Surface representations of the proteins are shown for the same protein orientations after superposition in PyMOL. Coloring is according to the fraction of buried surface area as determined by PDBePISA, with fully exposed residues in blue and fully buried residues in red.
