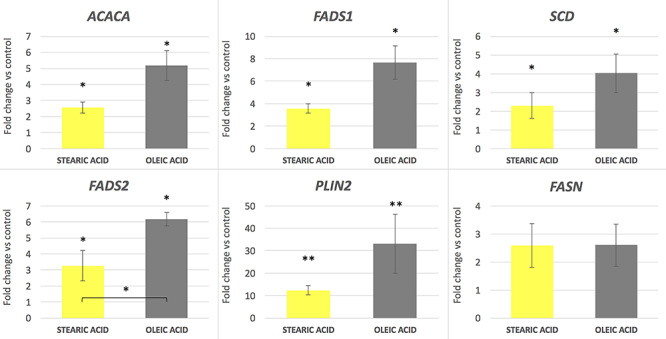
Figure 2.

mRNA gene expression level in corresponding cumulus cells after supplementation of maturation media with 150 μM of stearic and oleic fatty acids indicated as fold change relative to the control group (±SEM). *P < 0.05; **P < 0.01.

mRNA gene expression level in corresponding cumulus cells after supplementation of maturation media with 150 μM of stearic and oleic fatty acids indicated as fold change relative to the control group (±SEM). *P < 0.05; **P < 0.01.