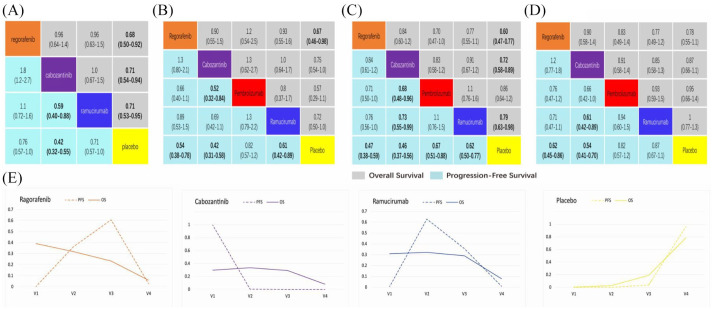
Figure 8.
Comparisons and ranking curves of efficacy in the subgroups.
Each cell of the block contains the pooled odds ratios and 95% credibility intervals for OS and PFS. Significant results are in bold. (a) AFP >400 subgroup, (b) MVI subgroup, (c) EHS subgroup, (d) ECOG PS1 subgroup, (e) ranking curves indicate the probability of the benefit of OS and PFS in AFP >400 subgroup. AFP, alpha-fetoprotein; ECOG PS, Eastern Cooperative Oncology Group performance status; EHS, extrahepatic spread; MVI, macrovascular invasion; PFS, progression-free survival; OS, overall survival

