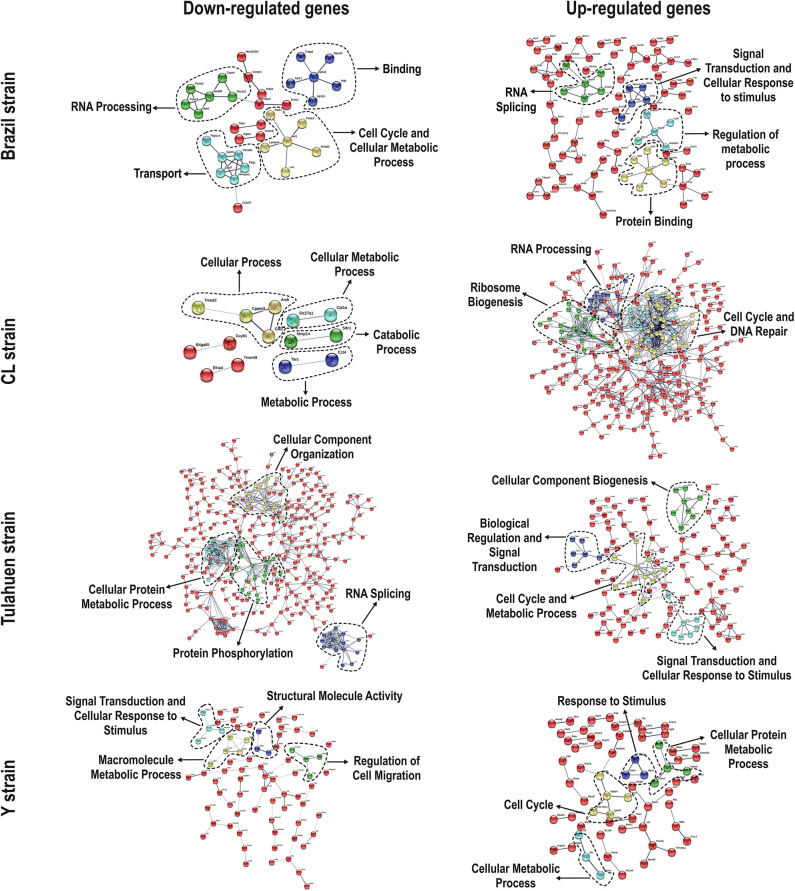
Figure 1.
Protein–protein interaction (PPI) networks revealed by upregulated and downregulated genes after infection with each Trypanosoma cruzi strain. Among the downregulated (left panels) and upregulated genes (right panels), we obtained/assembled PPIs using STRING software, with a confidence cut-off that ranged from 0.4 to 0.7. Nodes labeled with the encoding gene symbol indicate proteins, and the lines represent the corresponding interactions. The confidence score of each interaction is mapped to the line thickness (the thicker the line, the more evidence to support the interaction). The network was then enriched according to a gene ontology database. Subsequent analysis with K-means algorithm predicted nodes of interacting proteins (highlighted with the dashed lines), and such nodes were determined with Pathvisio assigning their molecular functions.

