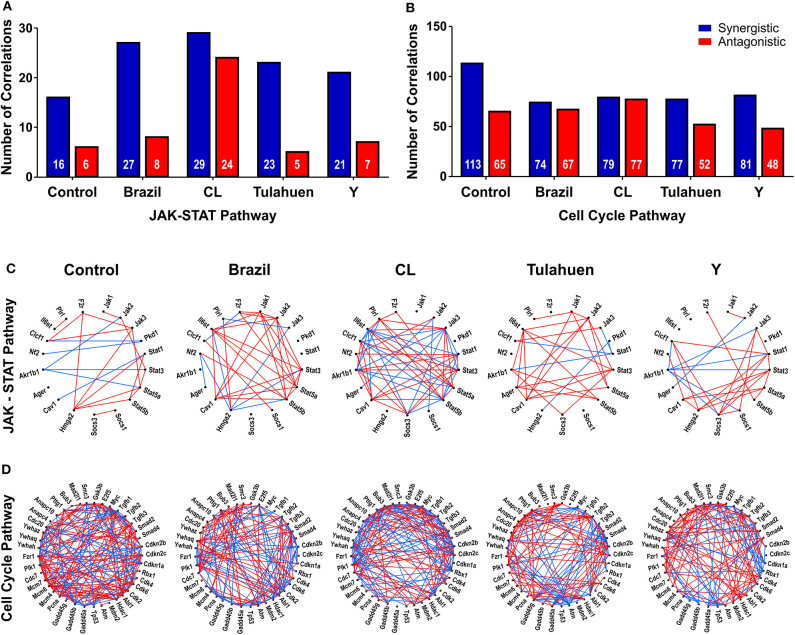
Figure 4.
Trypanosoma cruzi infection affects the coordination of genes belonging to JAK/STAT and cell cycle pathways. The number of synergisms (blue bars) and antagonisms (red bars) for the JAK/STAT (A) and Cell Cycle (B) pathways are shown, as determined by Pearson correlation analysis. The circles in (C,D) depict the synergistic (blue lines) and antagonistic (red lines) correlations between genes of each pathway, in uninfected and T. cruzi-infected datasets.

