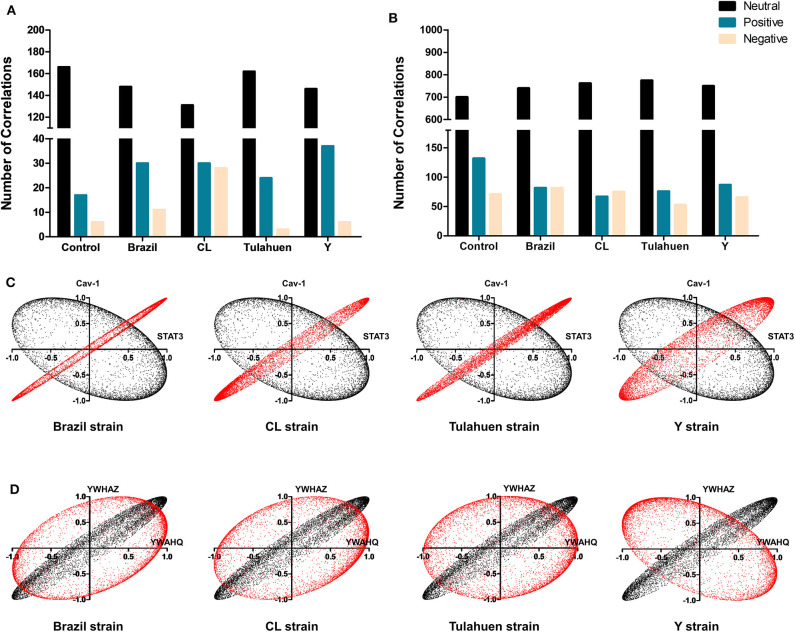
Figure 5.
Differential effects of infection on global gene correlation. Plots of correlation coefficients between the expression levels of the indicated genes with each other genes differentially expressed in each experimental condition. The number of neutral (black bars), positive (blue bars), and negative correlations (yellow bars) was quantified among genes belonging to the JAK/STAT (A) and Cell Cycle (B) pathways. T. cruzi infection increased the number of positive correlations of the JAK/STAT pathway, whereas an opposite effect was observed for Cell Cycle genes. In (C,D) are depicted representative correlation profiles of each pathway: cav-1 and stat3 of the JAK/STAT pathway (C) and YWHAZ and YWHAQ of the Cell Cycle Pathway (D). Profiles of the uninfected controls are represented by the black dots and T. cruzi-infected by red dots.

