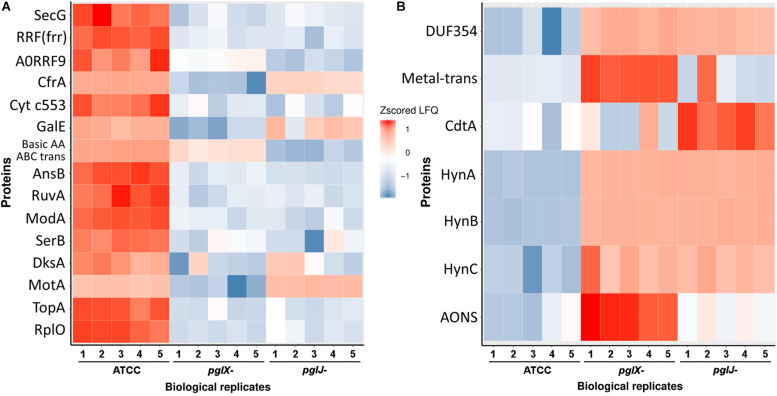
FIGURE 6.
Label-free quantification of proteins in Cff-pglJ- and pglX- strains compared to WT. (A,B) Heat maps of specific proteins with statistically significant decreases (A) or increases (B) in pglJ- and pglX- mutants compared to WT (labeled ATCC). Values are gray where MS did not identify fragments. This data represents samples from five biological replicates (B1–B5). The complete dataset is included in Supplementary Table S1.

