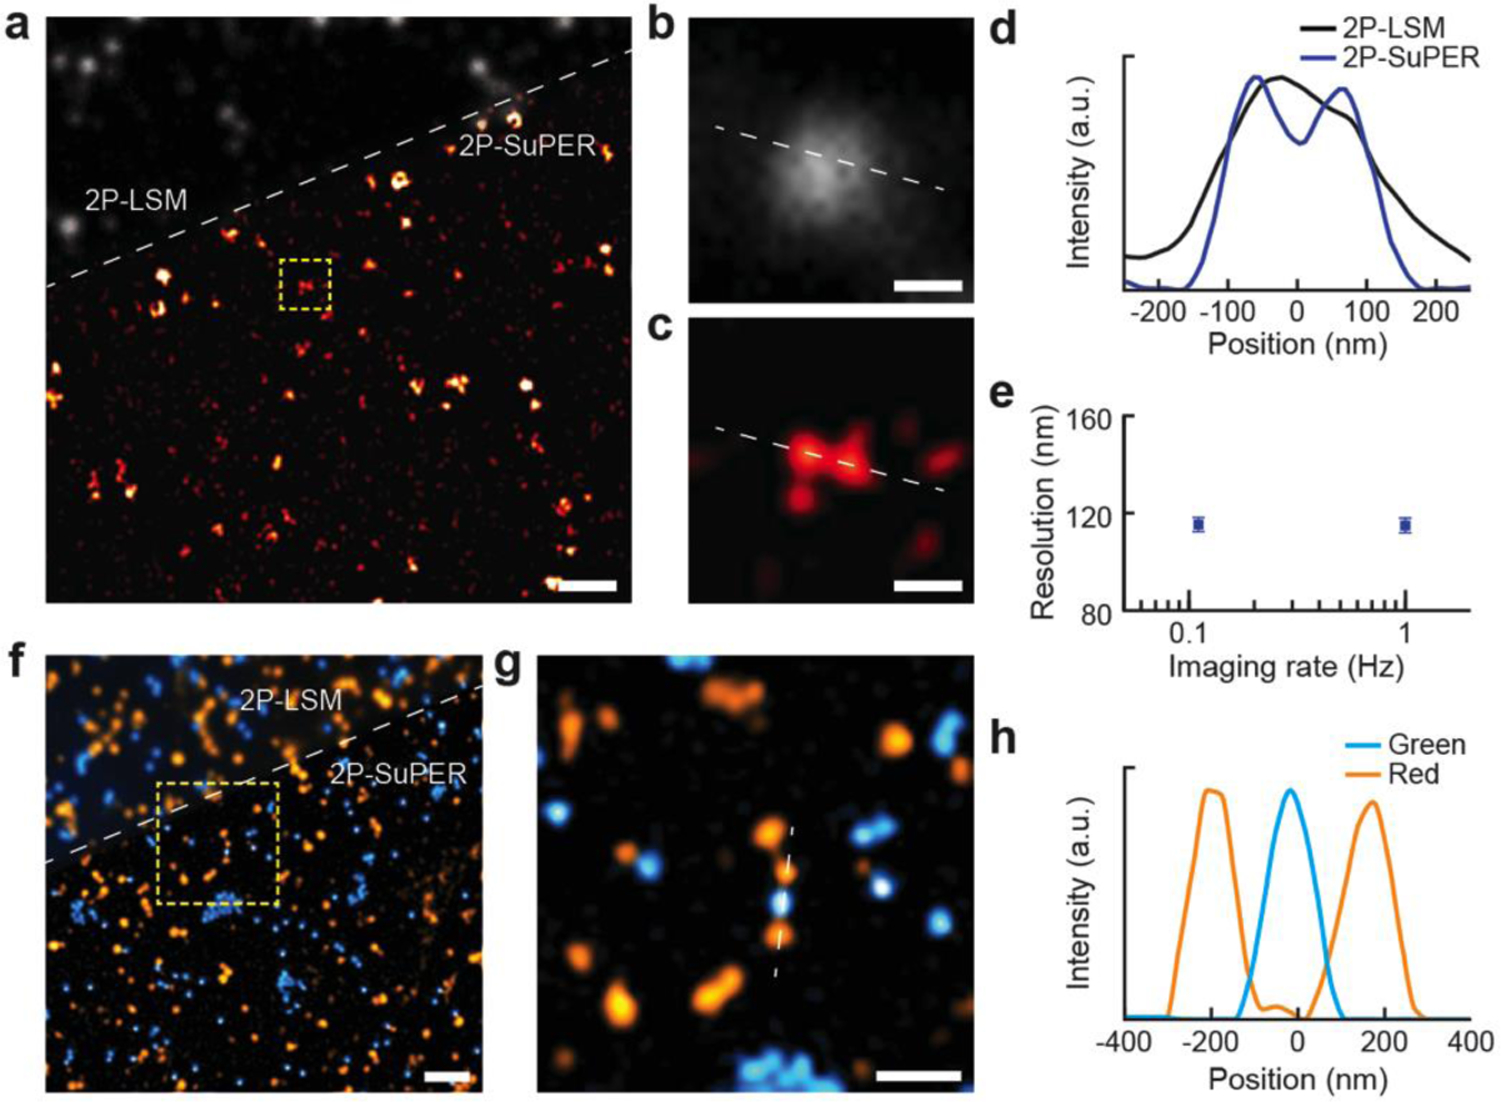
Figure 2.

Demonstration of improved spatial resolution and multicolor imaging capability of 2P-SuPER. (a) Comparison of 2P-LSM (grayscale, above dashed line) and 2P-SuPER microscopy (colored, below dashed line) imaging of red quantum dots (emission peak 600 nm, excited by a 780 nm laser beam). Scale bar: 2 μm; (b) Magnified region of the 2P-LSM image, indicated by the dashed box in panel a. Scale bar: 200 nm; (c) Same as panel b, but for 2P-SuPER; (d) Intensity profile of nearby quantum dots, shown by the dashed lines in panels b and c, imaged using 2P-LSM and 2P-SuPER microscopy; (e) Quantified spatial resolution of 2P-SuPER microscopy at two imaging speeds of 100 nm green fluorescent nanospheres. Boxes reflect the mean FWHM measurements of intensity profiles across the center of fluorescent points; error bars reflect s.e.m; (f) Comparison of multicolor 2P-LSM (top, above dashed line) and multicolor 2P-SuPER microscopy (bottom, below dashed line) imaging of green and red fluorescent nanospheres (respective emission peaks of 485 nm and 585 nm, excited by a 830 nm laser beam). Scale bar: 1 μm; (g) Magnified region of the 2P-SuPER image indicated by the dashed box in panel f. Scale bar: 500 nm; (h) Intensity profiles of three multicolor nanospheres, shown by the dashed line in panel g, imaged using 2P-SuPER microscopy. FWHM measurements of the intensity profiles in panel h demonstrate the increased resolution of 2P-SuPER for both color nanospheres.
