Figure 3.

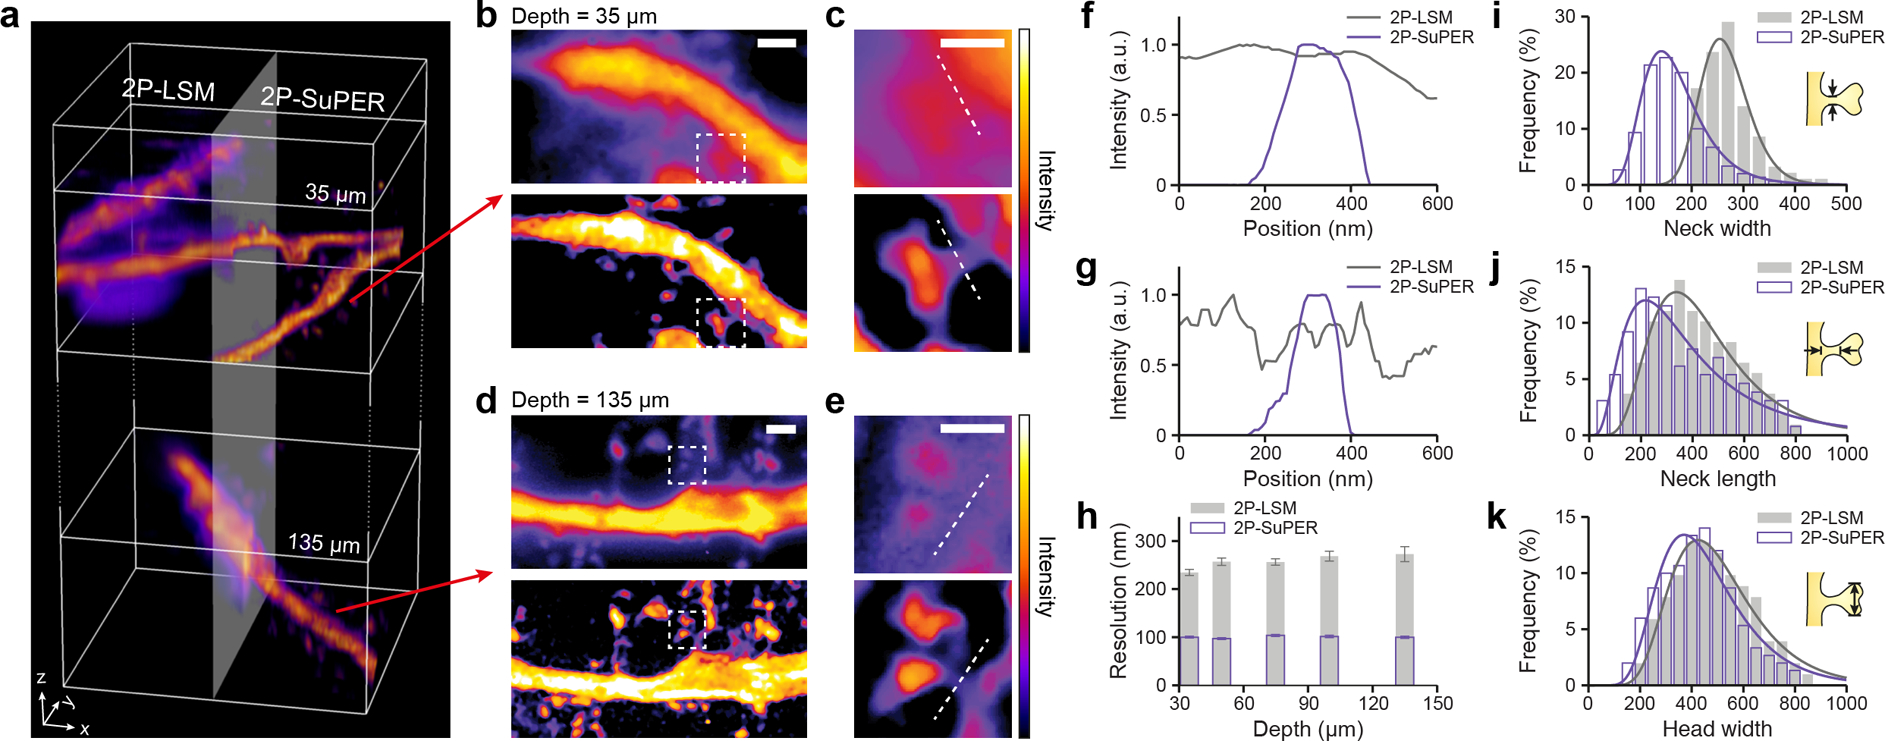
Comparison of 2P-LSM and 2P-SuPER imaging of dendrites at different depths. (a) A volumetric rendering of dendrites located 35 μm and 135 μm from the surface in a 300 μm-thick acute brain slice, imaged using 2P-LSM (left) and 2P-SuPER microscopy (right); (b) Projection images of the three-dimensional volumes shown at 35 μm, as indicated by the top red arrow in panel a, imaged by 2P-LSM (top) and 2P-SuPER microscopy (bottom). Scale bar, 1 μm; (c) Magnified views of the imaged regions highlighted by the dashed boxes in panel b. Scale bar: 500 nm; (d) Sum intensity projection of the three-dimensional volumes at 135 μm, as indicated by the bottom red arrow in panel a, imaged by 2P-LSM (top) and 2P-SuPER (bottom). Scale bar: 1 μm; (e) Magnified views of the imaged regions highlighted by the dashed boxes in panel d. Scale bar: 500 nm; (f) Intensity profiles of dendritic spine necks 35 μm from the surface of the brain slice acquired by 2P-LSM and 2P-SuPER, as indicated by the dashed lines in panel c; (g) Same as panel f, but 135 μm from the surface of the brain slice; (h) Average lateral resolution of 2P-LSM and 2P-SuPER microscopy, quantified by measuring the neck width of dendritic spines located at different depths in the acute brain slice. Error bars reflect s.e.m; (i) Comparison of dendritic spine neck width measurements using 2P-LSM and 2P-SuPER microscopy, all measurements are boxed in 30 nm bins; (j) Same as panel i, but for dendritic spine neck length; (k) Same as panel i, but for dendritic spine head width.
