
Figure 3:
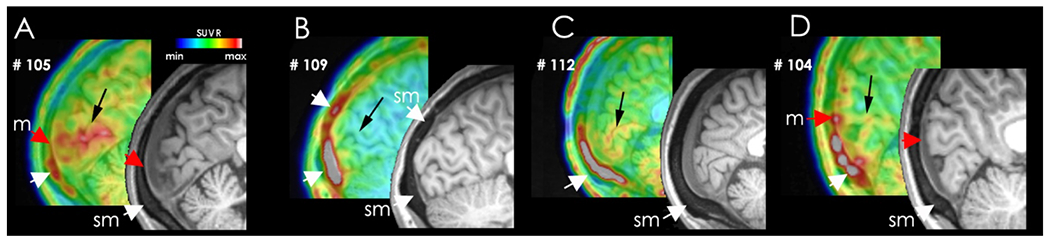
Native images of PET tracer uptake in the skull marrow/meninges in original PET/MRI data in the occipital cortex and adjacent PMT in four representative patients. Black arrows – primary visual cortex; sm – skull marrow; m – location of meninges. PET data are color-coded in a spectrum scale ranging from low (dark blue) to high (grey).