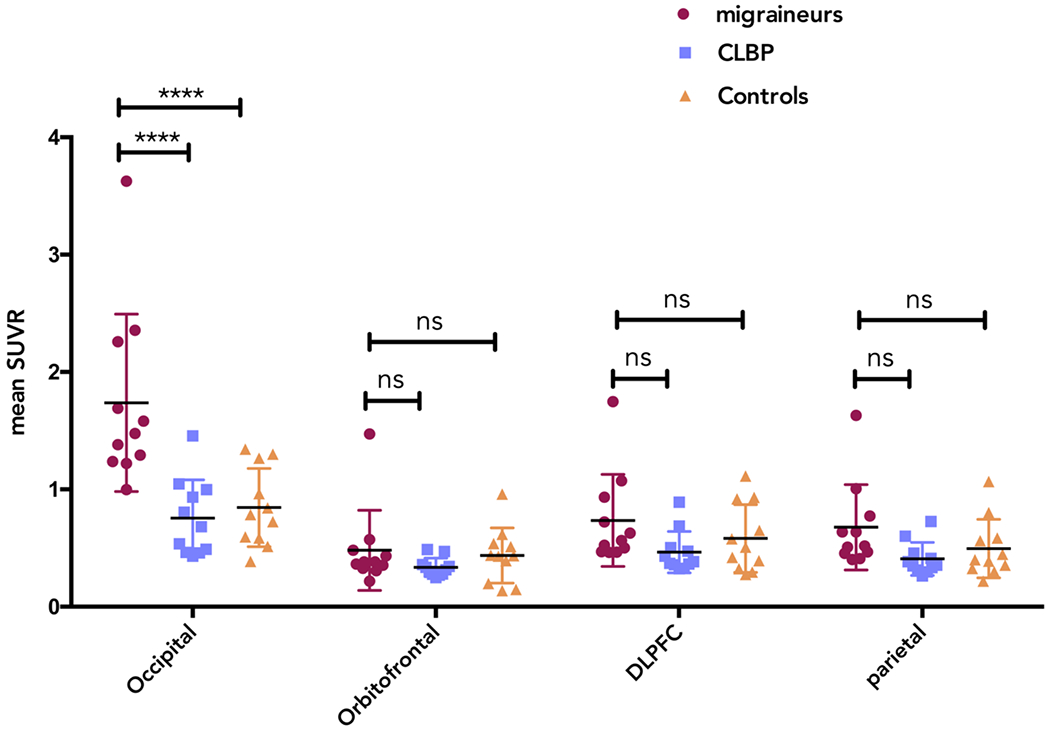
Figure 5:

Mean SUVR values in each ROI for each group in PMT overlying the occipital, orbitofrontal, DLPFC and parietal regions. Migraineurs with aura (MWA, circles), Chronic Low Back Pain patients (CLBP, squares) and healthy controls (CON, triangles). **** denotes statistical significance at a probability value of p<0.0001.
