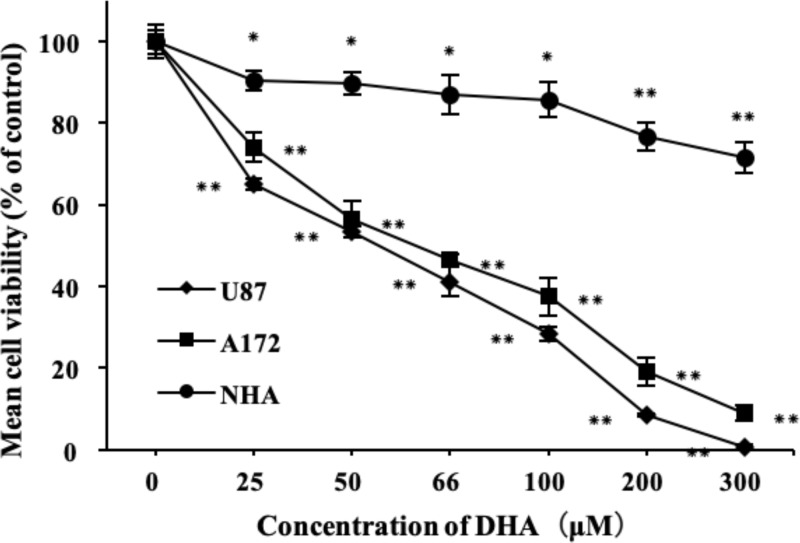
Figure 1. Effects of DHA on the viability of glioblastoma cell lines.
U87, A172 and NHA cells were treated with different concertrations of DHA (0–300 μM) for 24 h. Cell viability was measured by CCK-8 assay. Data are expressed as mean ± S.E.M. (n=3 for each group). *P<0.05; **P<0.01 versus control group.

