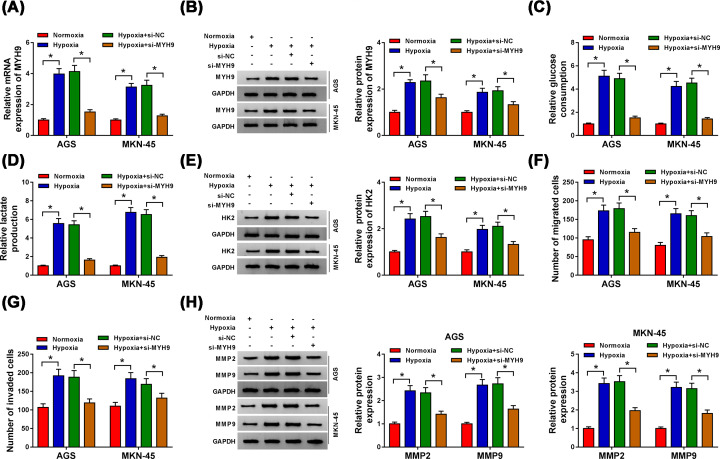
Figure 7. Knockdown of MYH9 curbed glycolysis, migration, and invasion in GC cells under hypoxia.
AGS and MKN-45 cells were transfected with si-NC or si-MYH9 after treatment of hypoxia. (A,B) The mRNA and protein levels of MYH9 were determined by qRT-PCR and Western blot, respectively. (C–E) Glucose consumption, lactate production, and HK2 protein expression were estimated by the Glucose Assay Kit, Lactate Assay Kit and Western blot, respectively. (F,G) Cell migration and invasion were evaluated by Transwell assay. (H) The protein expression levels of MMP2 and MMP9 were checked by Western blot. *P<0.05.

