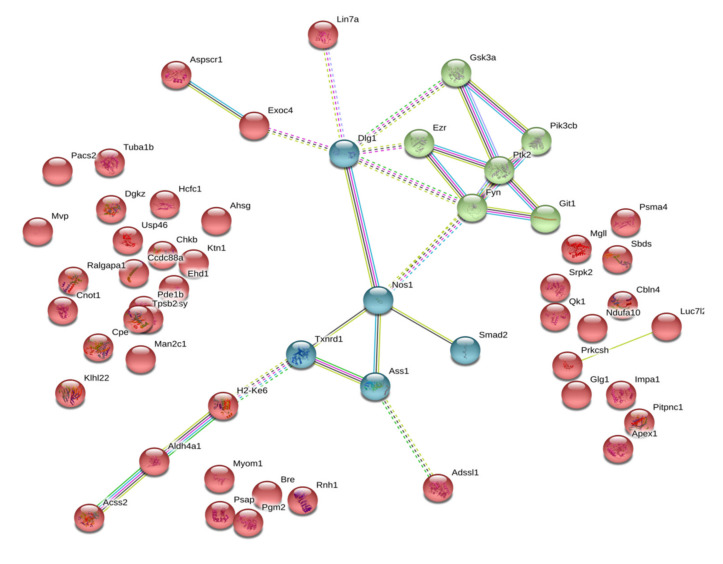
Figure 3.
Functional links between control-specific isatin-binding proteins of the mouse brain hemispheres. Line thickness and type (solid or dashed) reflect combined score and evidence suggesting a functional link. Bold lines indicate direct interactions between the identified proteins, annotated in String (v. 11.0 of January 19, 2019). Bold dashed lines show experimentally proven interactions between the identified proteins. Colors indicate different functional clusterization: red color shows lack of functional interactions, green color designates interaction between structural and regulatory proteins, blue color indicates interaction of proteins involved redox-dependent regulation.

