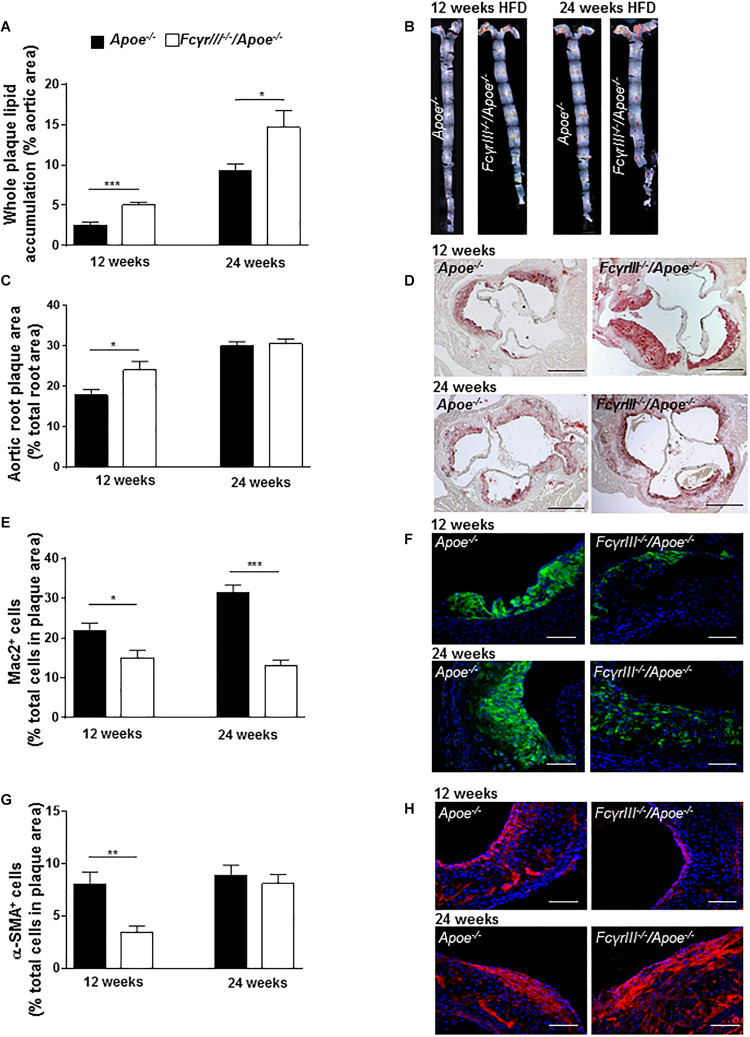
FIGURE 2.
Dichotomic role of FcγRIII in chronic atherosclerosis. (A–H) FcγrIII–/– Apoe–/–, and Apoe–/– mice received HFD for 12 and 24 weeks. (A) Quantification of lesion size in whole aorta (n = 6–9 mice per group). (B) Representative image of en face stained whole aorta lesions. (C) Quantification of lesion sizes in aortic root (n = 10–12 mice per group). (D) Representative image of Oil-Red-O stained aortic root lesion. Scale bar 500 μm. (E) Quantification of Mac-2 + macrophages (green). (F) Representative Mac-2 immunostaining (green). (G) Quantification of α-SMA smooth muscle cells. (H) Representative α-SMA immunostaining (red). Magnification × 40; scale bar 100 μm; and (n = 10 mice per group). Graphs represent mean ± SEM. 2-tailed t-test, *p < 0.05, **p < 0.01, ***p < 0.001.

