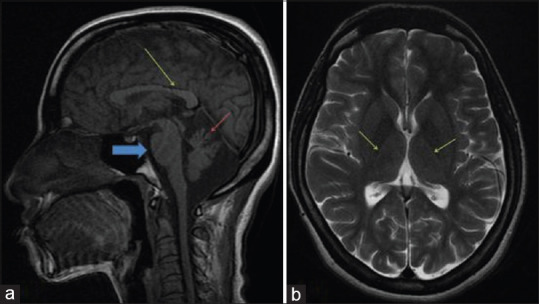
Figure 2.

Sagittal T1 MR images showing: (a) superior vermian atrophy (red arrow), “enlarged pons” (blue arrow), and thinning of the splenium of corpus callosum (yellow arrow). (b) Axial T2-weighted image shows a rim of hyperintensity around the thalami – “bithalamic stripes” (arrows)
