
Figure 1.
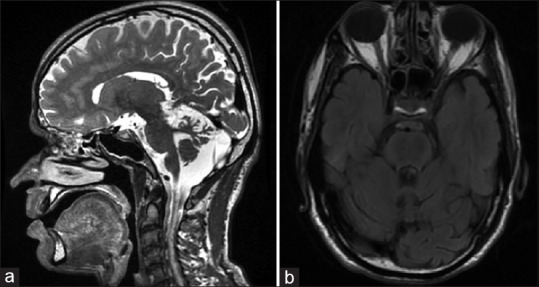
MRI brain T2 weighted image revealing superior cerebellar vermian atrophy (a) and linear “striped” hypointensities in pons (b)
Official websites use .gov
A
.gov website belongs to an official
government organization in the United States.
Secure .gov websites use HTTPS
A lock (
) or https:// means you've safely
connected to the .gov website. Share sensitive
information only on official, secure websites.
MRI brain T2 weighted image revealing superior cerebellar vermian atrophy (a) and linear “striped” hypointensities in pons (b)