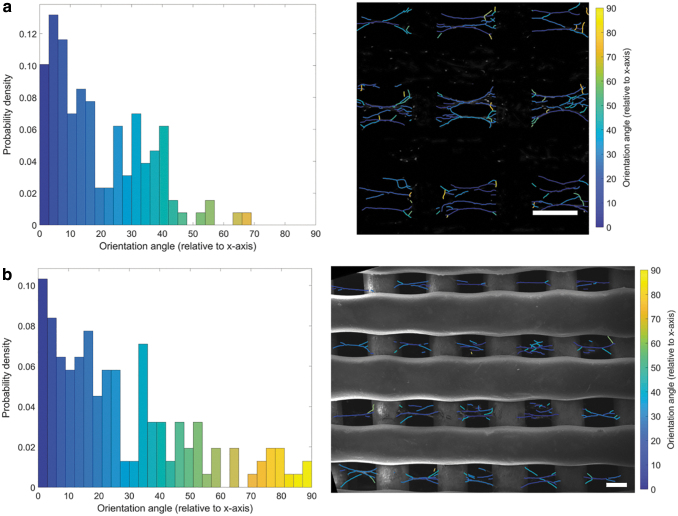
FIG. 6.
Cell orientation analysis. (a) Confocal (scale bar = 300 μm) and (b) SEM (scale bar = 150 μm) images of the cells cultured on the dual-scale scaffold (45 s) show aligned cell bodies with a high probability density at 0° and another distinct distribution at ∼40°. Color images are available online.

