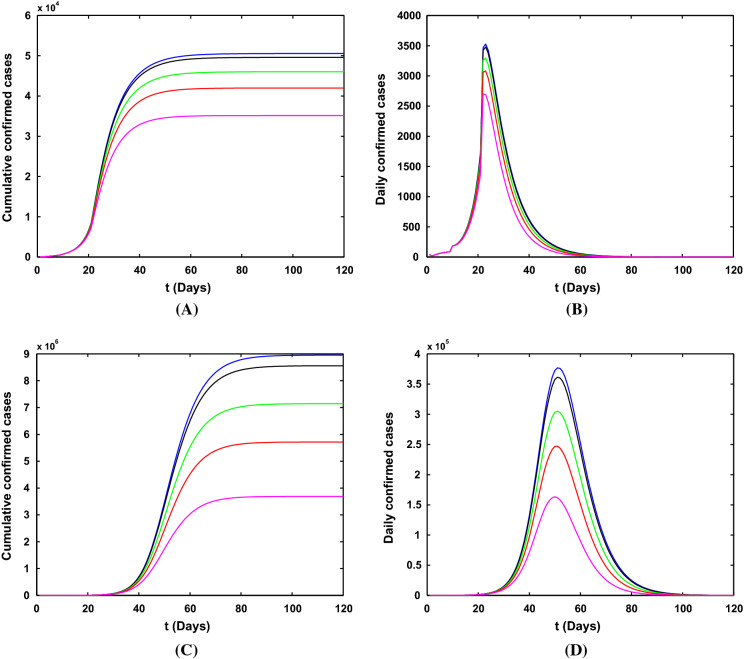
Fig. 9.
Simulation results for the number of confirmed COVID-19 cases with different lockdown strengths in Wuhan city. a, b The cumulative and newly cases with reliable medical resources and the strict community control strategy. c, d The cumulative and newly cases without reliable medical resources and the strict community control strategy. The orange, red, green, black and blue lines mean that the values of b (Wuhan lockdown strength) after January 23 are 0.02, 0.01, 0.005, 0.001 and 0, respectively

