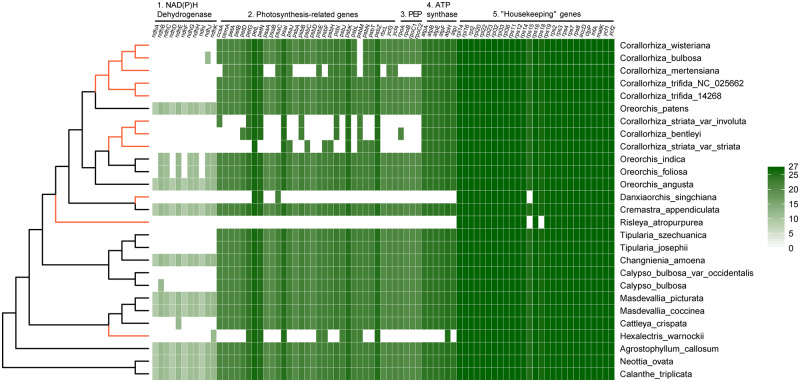
Fig. 1.
—Summary of retained genes in the plastomes of sampled species. Intact genes per species are indicated by green boxes, whereas the white boxes mark functional and or physical losses. The shading boxes (0–27) indicate the number of species in this study retaining the genes. Orange branch indicates leafless and mycoheterotrophic species.

