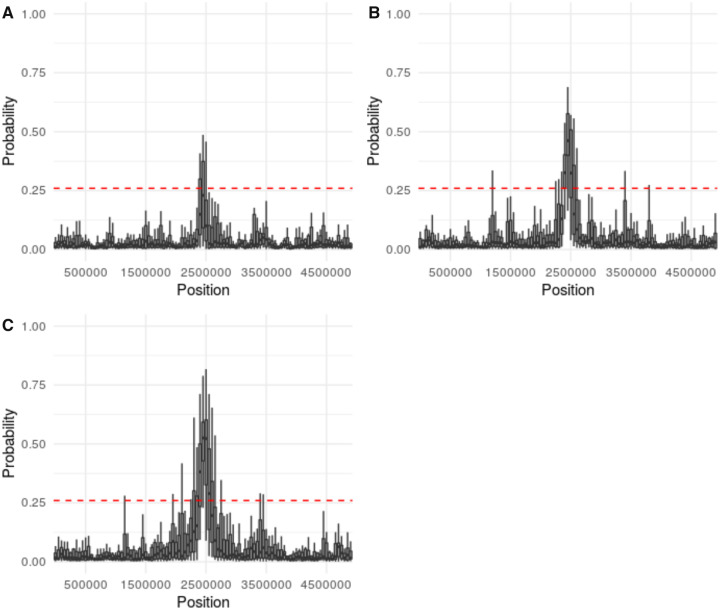
Fig. 2.
—Probability of accepting the MMC model in a population characterized by a bottlenecked (severity = 10%, duration = 100 generations) demographic history. We simulated 20 replicate sweeps (a representative replicate is plotted here) occurring from a de novo beneficial mutation at the center of the chromosome (site = 2,500,000) with a strength of (A) 2Ns = 100, (B) 2Ns = 250, and (C) 2Ns = 500. Probabilities were estimated along the 5-Mb chromosome in windows of 100 kb with a step size of 50 kb. The dashed red line indicates the 99% credible interval for accepting the MMC model under neutral conditions. Probability was estimated using the ABC rejection method with a tolerance of 10%. The ψ model included ∼U[0.004, 0.8]. As shown, performance remains strong as in figure 1, though a proportion of outlier regions now exist in which neutral trees are generated under this bottleneck model which become difficult to distinguish from the MMC trees generated by the selective sweep.

