
Fig. 4.
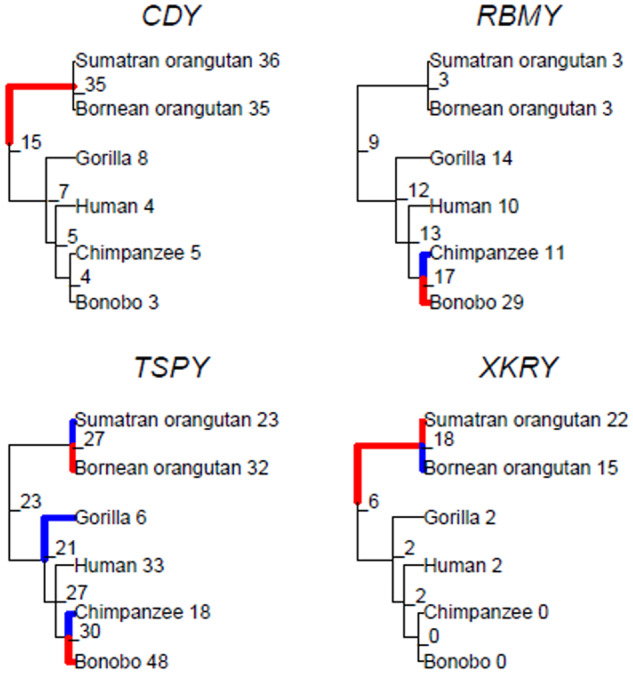
—Results of CAFE analysis identifying Y ampliconic gene families with significant shifts in gene copy number when compared with their ancestors. For each gene family with a significant difference in copy number, the phylogenetic tree representing the estimated copy number at internal nodes is shown. Significant shifts are highlighted in blue (contraction) and red (expansion). The copy numbers at the internal nodes were predicted by CAFE.