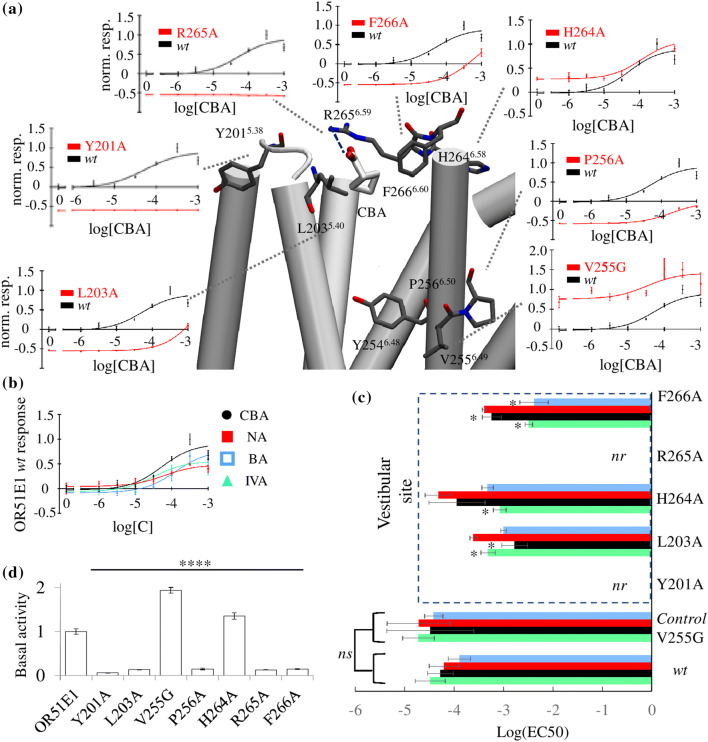
Fig. 4.
In vitro assessment of the functional role of the vestibule and the binding cavity. a Snapshot where CBA bound at the vestibular site can form a hydrogen bond with R2656.59 (blue dashed line) and hydrophobic contacts with L2035.40 and F2666.60. In this representation, extra-cellular loops are omitted for image clarity. For each residue near the agonist, normalized dose–response curves of the response of OR51E1 mutants (red) in comparison with the wt (black) to CBA stimulation are shown. The y-axis represents the firefly luminescence normalized to Renilla firefly and normalized to the wt response. b Normalized dose–response curves (error bars represent SD; n = 3) for OR51E1 wt to nonanoic acid (NA), isovaleric acid (IVA), and butyric acid (BA). c Log(EC50) values for the four agonists. Comparison between the wt and the mutant ORs at the position V2556.49 and at the vestibular site. nr non-responsive. Mutation V2556.49G, which does not interact with agonists, has no statistically significant (ns) effect on the EC50 for any agonist. Mutations at the vestibular site differentially affect potency. A ‘asterisk’ indicates that the 95% EC50 confidence intervals do not intersect (Table S3). The H2646.58A mutation only affects IVA binding, while the F2666.60A mutation affects all ligands except NA. The L203A5.40 mutation mostly decreases both CBA and IVA potencies. d Normalized basal activity for all mutant ORs normalized to wt. All mutants’ basal activity is significantly different than the wt (****p < 0.001; ANOVA Dunnett’s multiple comparisons test)

