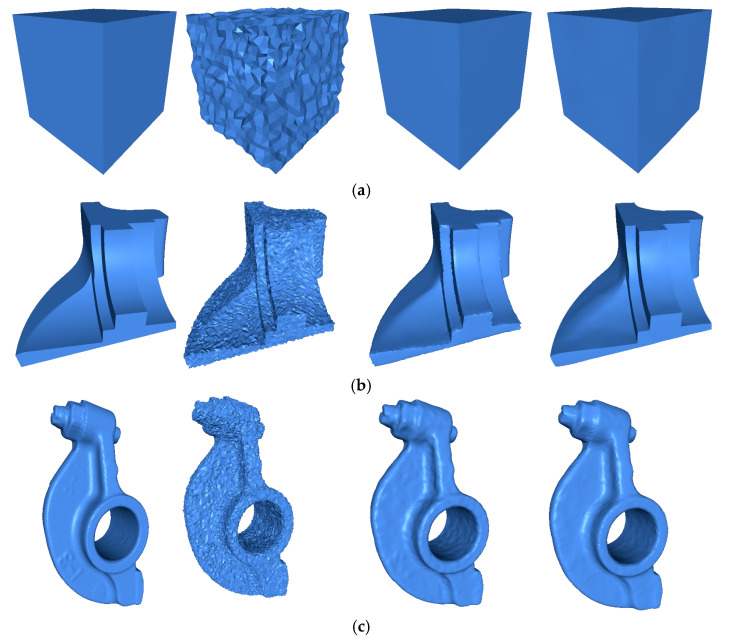
Figure 3.
The first column shows the model from the original data. The second model is corrupted by Gaussian noise. The third column shows most accurate result of the comparison methods using MSE metric. The fourth column shows the result of correcting by the proposed method. The Gaussian noise levels and the comparison method are (a) Cube method CVN, (b) Fandisk method RN, (c) Rocker Arm , and (d) Octhaedron .


