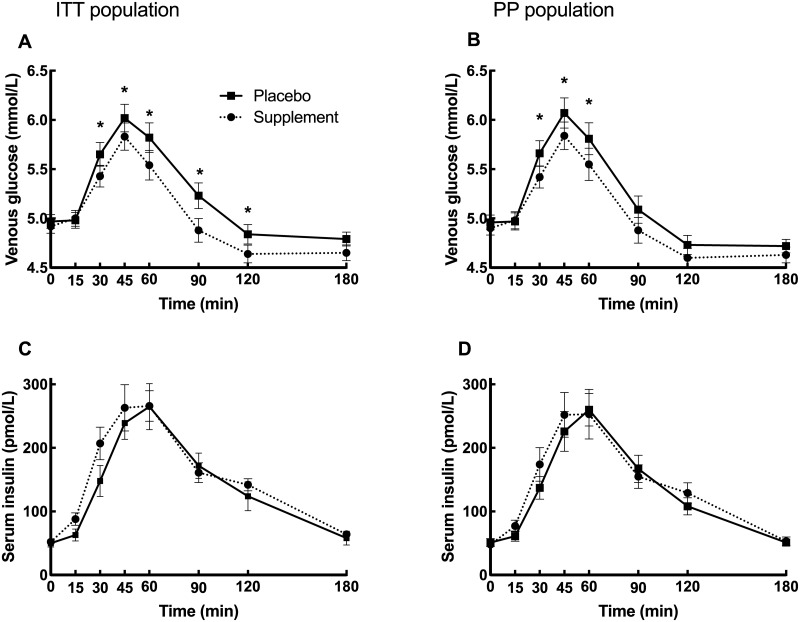
Fig 2. Postprandial glucose and insulin responses.
Glucose and insulin responses for the ITT (n = 54–58, for different time points) and PP (n = 48) populations respectively after intake of a high carbohydrate sandwich meal with supplement or placebo. Data are expressed as means ± SE. Asterisc (*) indicates a significant difference between treatments (p<0.05) at the respective time point.

