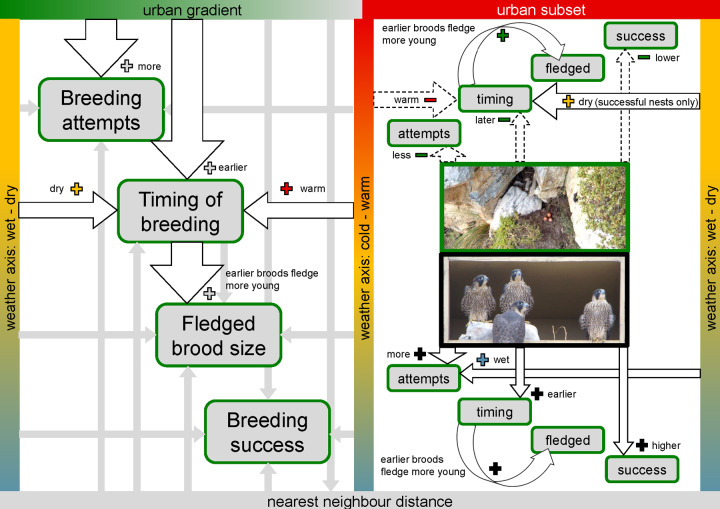
Fig 7. Visual summary.
Breeding phenology and productivity of peregrine falcons on the Cape Peninsula. The relationships between variables analysed, their direction (“+” solid arrows: positive; and, “-”dashed arrows: negative) and their strength [black outline: significant effects (thick P<0.001; medium P<0.01, and narrow P<0.05); grey arrows: non-significant effects]. Displayed for four different parameters during the breeding cycle. (left panel) Relationships for the full extent of the urban gradient (0–80% sealed surface areas) and between all predictors considered. (right panel) Relationships for the urban subset (>40% urbanisation) where all nest types were available (“nest boxes” versus “other” nest types) showing statistically significant effects only.

