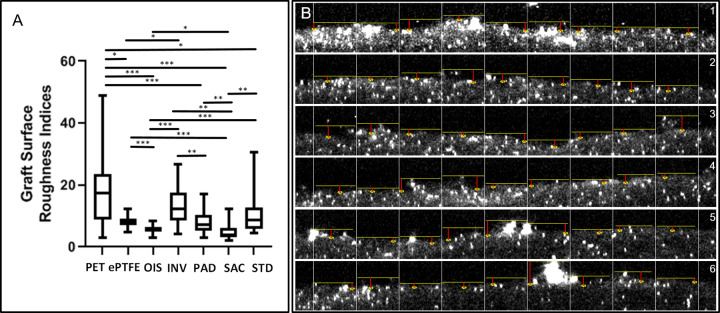
Fig 5. Graft surface roughness and representative measurements.
A) The box plots show the differences of the mean roughness indices (, μm) between the different graft surfaces. The statistical significances between the different grafts were as follows: p<0.0001 for PET versus OIS, PAD and SAC; ePTFE versus OIS and SAC; OIS versus INV and STD; p = 0.0002 for INV versus SAC; PAD versus SAC, SAC versus STD and INV versus PAD, p = 0.0028 for PET versus ePTFE, p = 0.0173 for PET versus STD; p = 0.0292 for ePTFE versus INV and p = 0.0156 for OIS versus PAD. The lower, mid and upper horizontal lines of the boxes represent 25th, 50th and 75th percentiles, respectively; the vertical lines extend from the 10th to the 90th percentile. B) Image shows the calculation for on the resliced CLSM stack for STD graft. The red line indicates the surface depth measured for each sub-division of the image. *p<0.05, **p<0.01, ***p<0.0001.

