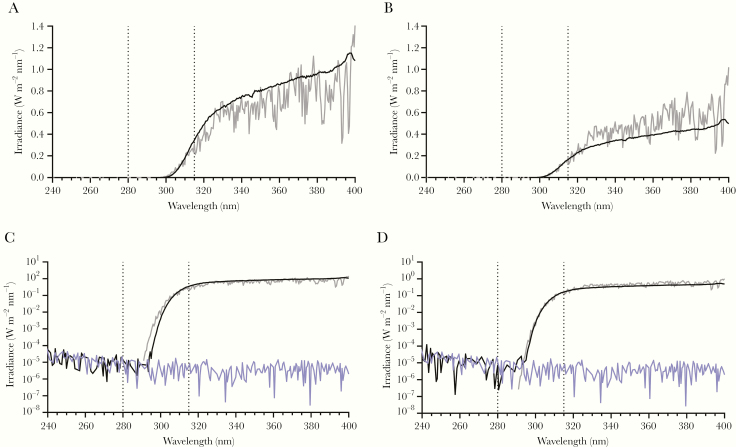
Figure 1.
Representative spectra for simulated sunlight. Simulated sunlight spectra utilized in the present study (black lines), spectra from the National Center for Atmospheric Research (NCAR) tropospheric ultraviolet and visible (TUV) radiation model for noon at 40°N latitude at sea level (gray lines), and spectra measured for darkness (blue lines) are shown (for color figure refer online version). A, Spectra for high-intensity simulated sunlight and TUV model for 21 June. B, Spectra for midintensity simulated sunlight and TUV model for both 7 March and 4 October. C, Spectra for high-intensity simulated sunlight and TUV model for 21 June, with irradiance plotted logarithmically. D, Spectra for midintensity simulated sunlight and TUV model for both 7 March and 4 October, with irradiance plotted logarithmically. Integrated irradiances for the UVA and UVB portions of the spectra for both the measured and TUV model spectra demonstrate close agreement between the measured and model values. For high-intensity simulated sunlight, measured integrated UVB irradiance was 1.91 W/m2 vs 1.84 W/m2 predicted by TUV for 21 June. Measured integrated UVA irradiance was 69.76 W/m2 vs 58.50 W/m2 predicted by TUV for 21 June. For midintensity simulated sunlight, measured integrated UVB irradiance was 0.94 W/m2 vs 0.92 W/m2 predicted by TUV for 7 March and 4 October. Measured integrated UVA irradiance was 31.97 W/m2 vs 40.54 and 40.25 W/m2 predicted by TUV for 7 March and 4 October, respectively. No irradiance was detectable above the background of the spectroradiometer measured in darkness for wavelengths less than approximately 295 nm. Vertical dashed lines represent the cutoffs between UVC and UVB (280 nm), and UVB and UVA (315 nm).

